two students compared the scores on their math tests. their results on 9 tests are shown in the box plots…
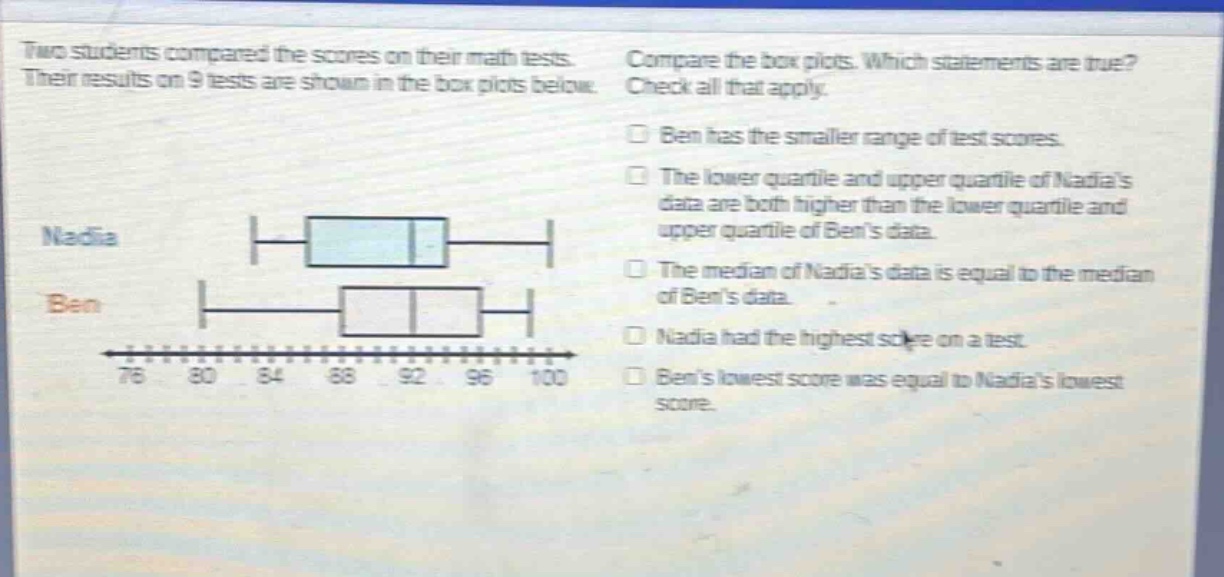
two students compared the scores on their math tests. their results on 9 tests are shown in the box plots below. compare the box plots. which statements are true? check all that apply. ben has the smaller range of test scores. the lower quartile and upper quartile of nadias data are both higher than the lower quartile and upper quartile of bens data. the median of nadias data is equal to the median of bens data. nadia had the highest score on a test. bens lowest score was equal to nadias lowest score.
Answer
Answer:
- Ben has the smaller range of test scores.
- The lower quartile and upper quartile of Nadia's data are both higher than the lower quartile and upper quartile of Ben's data.
- Nadia had the highest score on a test.
Explanation:
Step1: Recall range formula
Range = Maximum - Minimum
Step2: Analyze Nadia's range
Nadia's maximum is 100, minimum is 76, range = 100 - 76 = 24
Step3: Analyze Ben's range
Ben's maximum is 96, minimum is 80, range = 96 - 80 = 16. So Ben has smaller range.
Step4: Check quartiles
Nadia's lower - quartile is around 84, upper - quartile around 92. Ben's lower - quartile is around 82, upper - quartile around 90. Nadia's quartiles are higher.
Step5: Check highest score
Nadia's maximum is 100 and Ben's is 96, so Nadia had highest score.
Step6: Check lowest score
Nadia's lowest is 76 and Ben's is 80, they are not equal.
Step7: Check medians
Nadia's median is around 88, Ben's median is around 86, they are not equal.