between which two values would 75% of the data represented on a box plot lie? check all that apply. the…
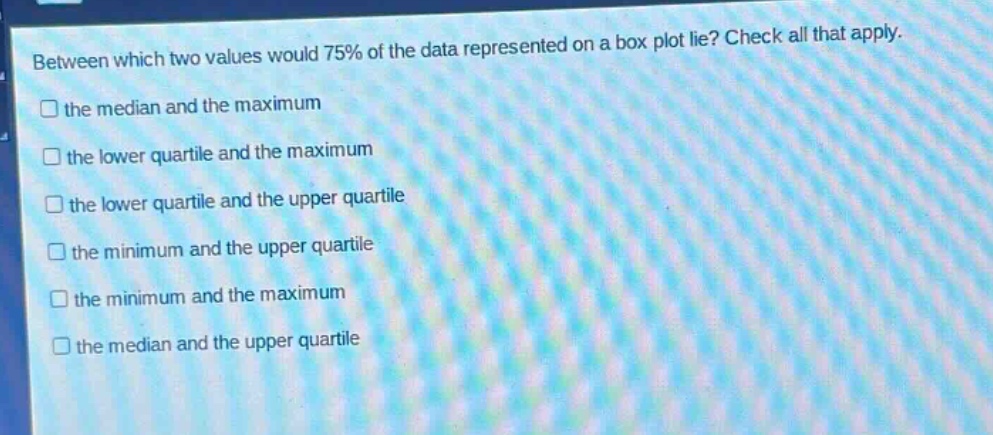
between which two values would 75% of the data represented on a box plot lie? check all that apply. the median and the maximum the lower quartile and the maximum the lower quartile and the upper quartile the minimum and the upper quartile the minimum and the maximum the median and the upper quartile
Answer
Explanation:
Step1: Recall quartile - data relationship
In a box - plot, the lower quartile ($Q_1$) represents the 25th percentile, the median ($Q_2$) represents the 50th percentile, and the upper quartile ($Q_3$) represents the 75th percentile, and the maximum value represents the 100th percentile, the minimum value represents the 0th percentile.
Step2: Analyze each option
- Option 1: the median and the maximum: The data between the median ($50^{th}$ percentile) and the maximum ($100^{th}$ percentile) is $100 - 50=50%$ of the data.
- Option 2: the lower quartile and the maximum: The lower quartile is the $25^{th}$ percentile and the maximum is the $100^{th}$ percentile. So the proportion of data between them is $100 - 25 = 75%$.
- Option 3: the lower quartile and the upper quartile: The proportion of data between the lower quartile ($25^{th}$ percentile) and the upper quartile ($75^{th}$ percentile) is $75 - 25=50%$.
- Option 4: the minimum and the upper quartile: The minimum is the $0^{th}$ percentile and the upper quartile is the $75^{th}$ percentile. So the proportion of data between them is $75-0 = 75%$.
- Option 5: the minimum and the maximum: The proportion of data between the minimum ($0^{th}$ percentile) and the maximum ($100^{th}$ percentile) is $100 - 0=100%$.
- Option 6: the median and the upper quartile: The proportion of data between the median ($50^{th}$ percentile) and the upper quartile ($75^{th}$ percentile) is $75 - 50 = 25%$.
Answer:
the lower quartile and the maximum, the minimum and the upper quartile