the two - way frequency table represents data from a survey asking mall visitors whether they like seafood…
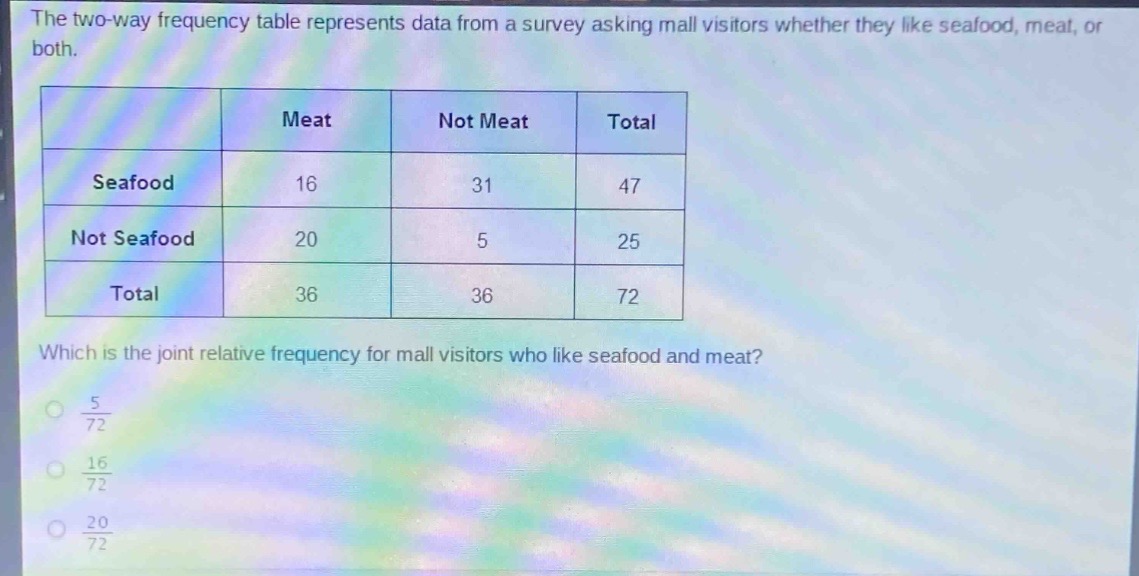
the two - way frequency table represents data from a survey asking mall visitors whether they like seafood, meat, or both.\n| | meat | not meat | total |\n|--|--|--|--| \n| seafood | 16 | 31 | 47 |\n| not seafood | 20 | 5 | 25 |\n| total | 36 | 36 | 72 |\nwhich is the joint relative frequency for mall visitors who like seafood and meat?\n$\frac{5}{72}$\n$\frac{16}{72}$\n$\frac{20}{72}$
Answer
Explanation:
Step1: Recall joint - relative frequency formula
Joint relative frequency = $\frac{\text{Frequency in the cell}}{\text{Total frequency}}$
Step2: Identify relevant values
The number of mall - visitors who like seafood and meat is 16 (the value in the "Seafood" row and "Meat" column). The total number of mall - visitors surveyed is 72 (the value in the bottom - right cell of the table).
Step3: Calculate joint relative frequency
Joint relative frequency = $\frac{16}{72}$
Answer:
$\frac{16}{72}$