the two - way table represents data from a survey asking students whether they plan to attend college…
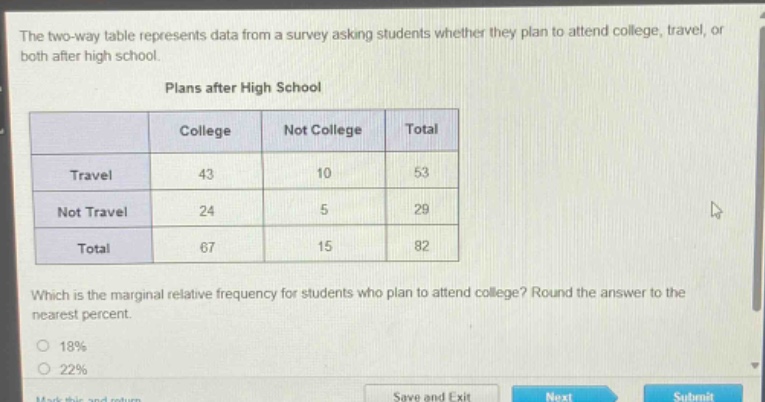
the two - way table represents data from a survey asking students whether they plan to attend college, travel, or both after high school.\nplans after high school\n| | college | not college | total |\n|--|--|--|--|\n| travel | 43 | 10 | 53 |\n| not travel | 24 | 5 | 29 |\n| total | 67 | 15 | 82 |\nwhich is the marginal relative frequency for students who plan to attend college? round the answer to the nearest percent.\n18%\n22%
Answer
Answer:
82%
Explanation:
Step1: Recall marginal relative frequency formula
Marginal relative frequency = $\frac{\text{Row/Column Total}}{\text{Grand Total}}$
Step2: Identify relevant totals
Total students who plan to attend college = 67, Grand total of students = 82
Step3: Calculate marginal relative frequency
$\frac{67}{82}\approx0.817$
Step4: Convert to percentage and round
$0.817\times100 = 81.7%\approx82%$