the two - way table represents data from a survey asking teachers whether they teach english, math, or…
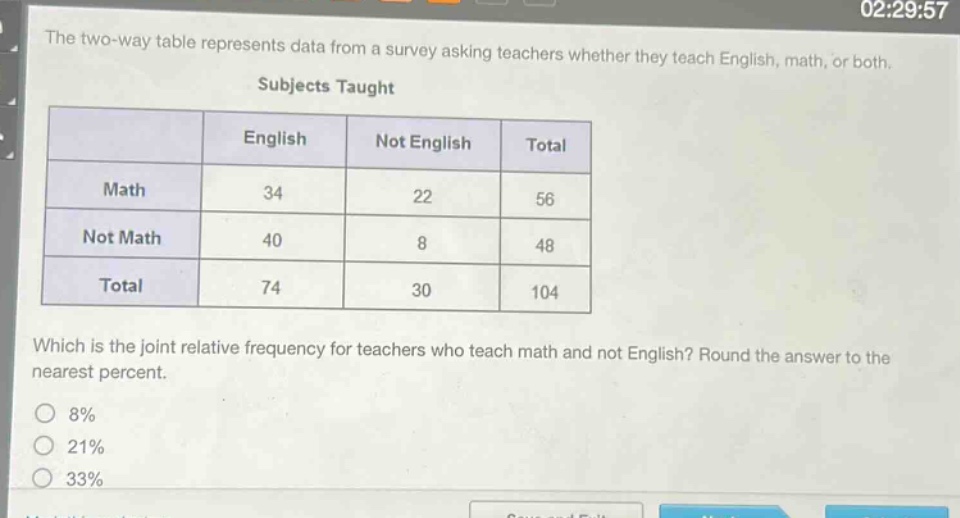
the two - way table represents data from a survey asking teachers whether they teach english, math, or both.\nsubjects taught\n| | english | not english | total |\n|--|--|--|--|\n| math | 34 | 22 | 56 |\n| not math | 40 | 8 | 48 |\n| total | 74 | 30 | 104 |\nwhich is the joint relative frequency for teachers who teach math and not english? round the answer to the nearest percent.\n8%\n21%\n33%
Answer
Explanation:
Step1: Recall joint - relative frequency formula
Joint relative frequency = $\frac{\text{Frequency of the cell}}{\text{Total number of data points}}$
Step2: Identify the frequency of the cell and total
The frequency of teachers who teach math and not English is 22. The total number of teachers surveyed is 104.
Step3: Calculate the joint - relative frequency
Joint relative frequency = $\frac{22}{104}\approx 0.2115$
Step4: Convert to percentage
$0.2115\times100 = 21.15%$, rounded to the nearest percent is 21%
Answer:
21%