type the correct answer in the box. use numerals instead of words. if necessary, use / for the fraction…
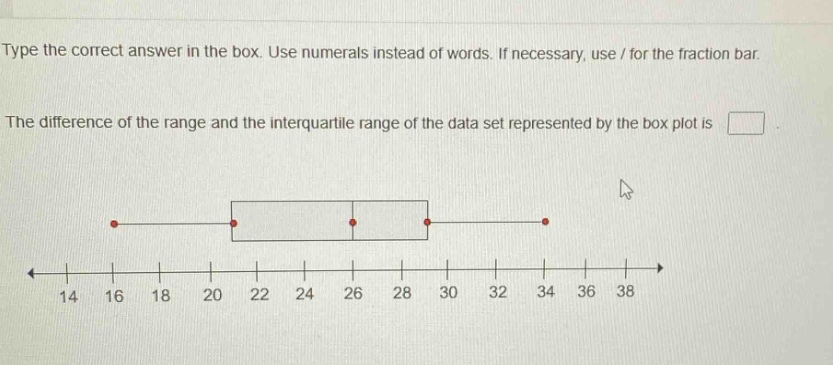
type the correct answer in the box. use numerals instead of words. if necessary, use / for the fraction bar.\nthe difference of the range and the interquartile range of the data set represented by the box plot is \n\n14 16 18 20 22 24 26 28 30 32 34 36 38
Answer
Explanation:
Step1: Find the range
The range is the difference between the maximum and minimum values. From the box - plot, the minimum value is 16 and the maximum value is 36. So, the range $R=36 - 16=20$.
Step2: Find the inter - quartile range
The inter - quartile range (IQR) is the difference between the third quartile ($Q_3$) and the first quartile ($Q_1$). From the box - plot, $Q_1 = 22$ and $Q_3=28$. So, the IQR $=Q_3 - Q_1=28 - 22 = 6$.
Step3: Find the difference
We want to find the difference between the range and the inter - quartile range. Let $D$ be the difference. Then $D=R - IQR$. Substituting the values of $R$ and IQR, we get $D = 20-6=14$.
Answer:
14