type the correct answer in the box. use numerals instead of words. if necessary, use / for the fraction bar…
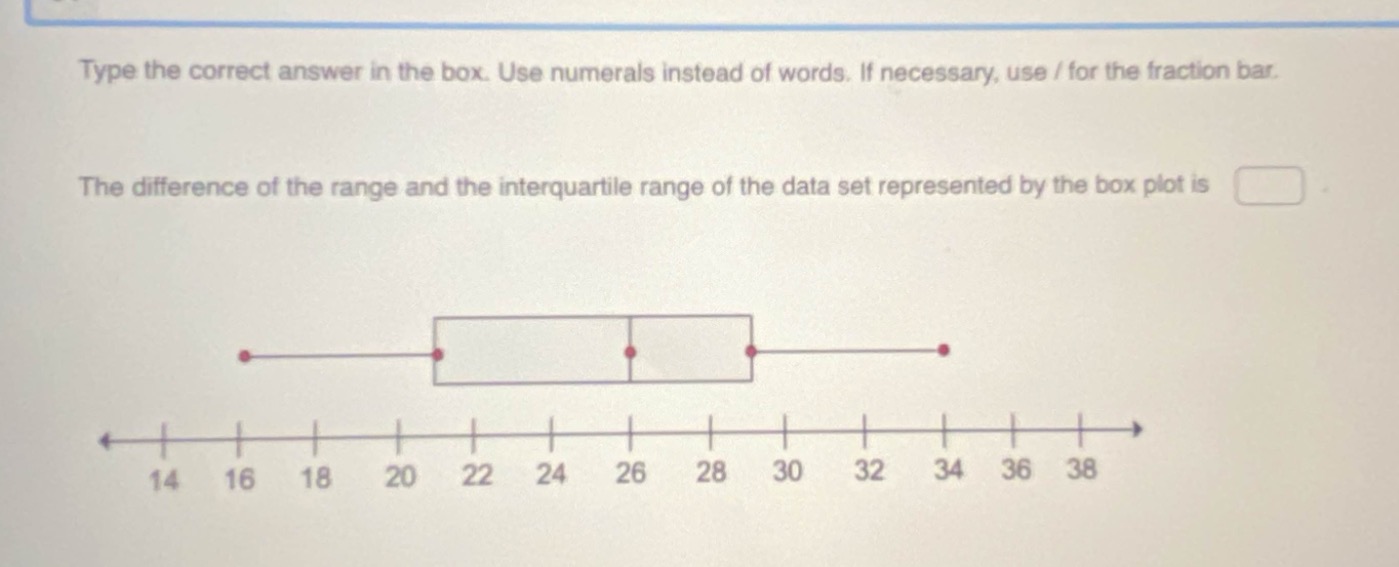
type the correct answer in the box. use numerals instead of words. if necessary, use / for the fraction bar. the difference of the range and the interquartile range of the data set represented by the box plot is
Answer
Explanation:
Step1: Calculate the range
The range is the difference between the maximum and minimum values. From the box - plot, the minimum value is 16 and the maximum value is 36. So, the range $R=36 - 16=20$.
Step2: Calculate the inter - quartile range
The inter - quartile range (IQR) is the difference between the third quartile ($Q_3$) and the first quartile ($Q_1$). From the box - plot, $Q_1 = 22$ and $Q_3=28$. So, the IQR $=Q_3 - Q_1=28 - 22 = 6$.
Step3: Calculate the difference
We want to find the difference between the range and the inter - quartile range. Let $D$ be the difference. Then $D=R - IQR$. Substituting the values of $R$ and IQR, we get $D = 20-6=14$.
Answer:
14