type the correct answer in the box. use numerals instead of words. if necessary, use / for the fraction bar…
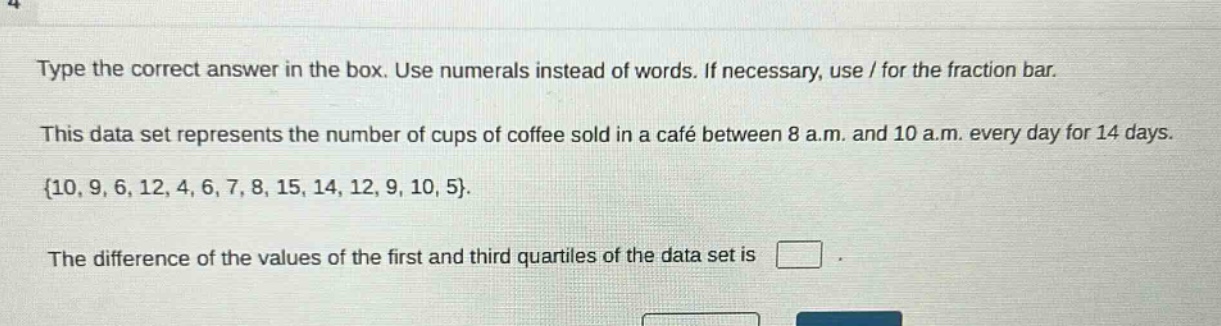
type the correct answer in the box. use numerals instead of words. if necessary, use / for the fraction bar. this data set represents the number of cups of coffee sold in a café between 8 a.m. and 10 a.m. every day for 14 days. {10, 9, 6, 12, 4, 6, 7, 8, 15, 14, 12, 9, 10, 5}. the difference of the values of the first and third quartiles of the data set is
Answer
Explanation:
Step1: Sort the data set
$4,5,6,6,7,8,9,9,10,10,12,12,14,15$
Step2: Find the median (Q2)
Since $n = 14$ (even), $Q2=\frac{9 + 9}{2}=9$
Step3: Find the lower - half data set
The lower - half is $4,5,6,6,7,8$
Step4: Find Q1
Since the number of data points in the lower - half is $n_1 = 6$ (even), $Q1=\frac{6+6}{2}=6$
Step5: Find the upper - half data set
The upper - half is $10,10,12,12,14,15$
Step6: Find Q3
Since the number of data points in the upper - half is $n_2 = 6$ (even), $Q3=\frac{12 + 12}{2}=12$
Step7: Calculate the inter - quartile range (IQR)
$IQR=Q3 - Q1=12-6 = 6$
Answer:
6