type in the five - number summary for the data shown on the right. the minimum of the data is. the first…
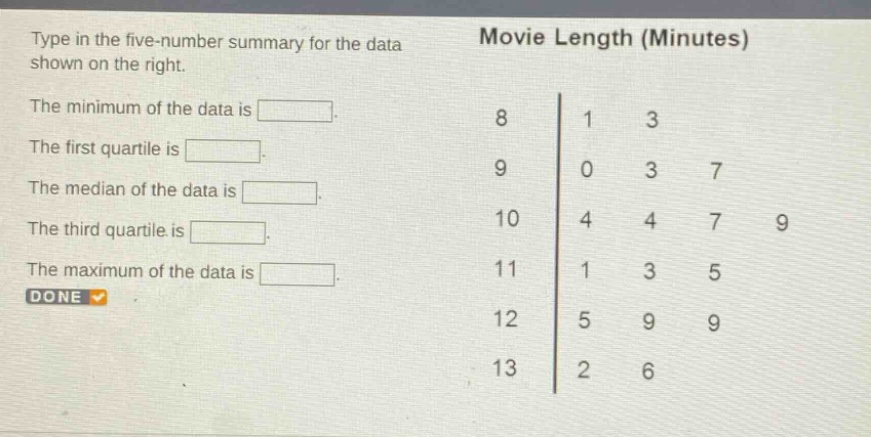
type in the five - number summary for the data shown on the right. the minimum of the data is. the first quartile is. the median of the data is. the third quartile is. the maximum of the data is. movie length (minutes) 8 1 3 9 0 3 7 10 4 4 7 9 11 1 3 5 12 5 9 9 13 2 6 done
Answer
Explanation:
Step1: Write out the data set
The data set from the stem - and - leaf plot is: 81, 83, 90, 93, 97, 104, 104, 107, 109, 111, 113, 115, 125, 129, 129, 132, 136.
Step2: Find the minimum
The minimum value is the smallest number in the data set. So, the minimum is 81.
Step3: Find the first quartile ($Q_1$)
First, find the median of the lower half of the data. There are $n = 17$ data points. The lower half consists of the first 8 data points. The median of the lower half (for $n = 8$) is the average of the 4th and 5th ordered values. The 4th value is 93 and the 5th value is 97. So, $Q_1=\frac{93 + 97}{2}=95$.
Step4: Find the median ($Q_2$)
For $n = 17$ (an odd - numbered data set), the median is the $\left(\frac{n + 1}{2}\right)$-th value. $\frac{17+1}{2}=9$th value. The 9th value is 109.
Step5: Find the third quartile ($Q_3$)
The upper half of the data consists of the last 8 data points. The median of the upper half (for $n = 8$) is the average of the 4th and 5th ordered values in the upper - half. The 4th value in the upper - half is 125 and the 5th value is 129. So, $Q_3=\frac{125+129}{2}=127$.
Step6: Find the maximum
The maximum value is the largest number in the data set. So, the maximum is 136.
Answer:
The minimum of the data is 81. The first quartile is 95. The median of the data is 109. The third quartile is 127. The maximum of the data is 136.