which type of graph would be most appropriate to display this data?\n a histogram\n a pie chart\n a box…
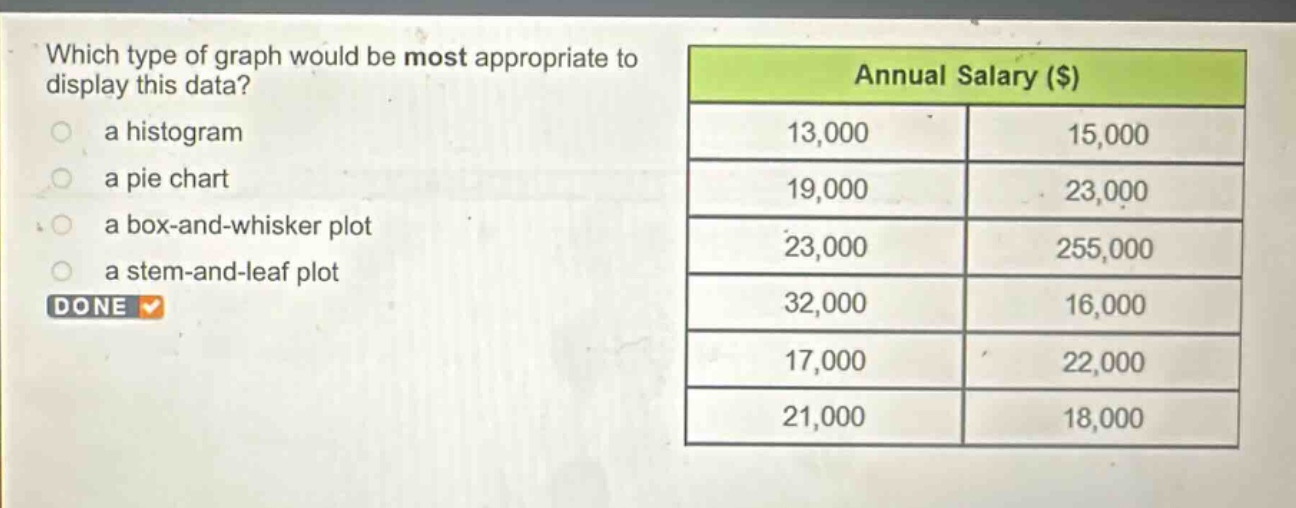
which type of graph would be most appropriate to display this data?\n a histogram\n a pie chart\n a box - and - whisker plot\n a stem - and - leaf plot\ndone\nannual salary ($)\n13,000\t15,000\n19,000\t23,000\n23,000\t255,000\n32,000\t16,000\n17,000\t22,000\n21,000\t18,000
Answer
Answer:
A. a histogram
Brief Explanations:
The data is a set of numerical values (annual salaries). A histogram is good for showing the distribution of numerical data within intervals. A pie - chart is for showing proportions of a whole, a box - and - whisker plot is for showing quartiles and outliers, and a stem - and - leaf plot is better for smaller data sets to show individual values. Here, a histogram is most appropriate for visualizing the distribution of the salary data.