understanding slope\nuse the regression line for the data in the scatter - plot to answer the question. on…
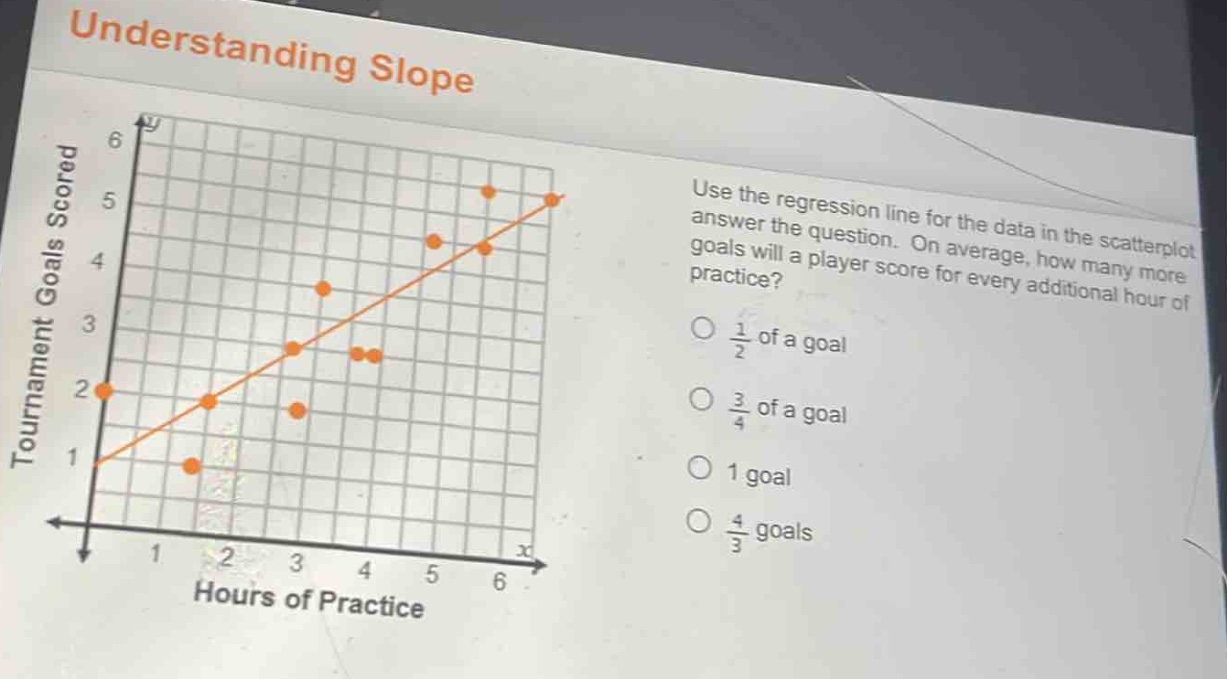
understanding slope\nuse the regression line for the data in the scatter - plot to answer the question. on average, how many more goals will a player score for every additional hour of practice?\n○ $\frac{1}{2}$ of a goal\n○ $\frac{3}{4}$ of a goal\n○ 1 goal\n○ $\frac{4}{3}$ goals
Answer
Answer:
B. $\frac{3}{4}$ of a goal
Explanation:
Step1: Recall slope - concept
The slope of the regression line represents the change in the y - variable (goals scored) for a unit change in the x - variable (hours of practice).
Step2: Select two points on the line
Let's take two points on the regression line, say $(2,2)$ and $(6,5)$.
Step3: Calculate the slope
The slope formula is $m=\frac{y_2 - y_1}{x_2 - x_1}$. Here, $x_1 = 2,y_1 = 2,x_2=6,y_2 = 5$. So $m=\frac{5 - 2}{6 - 2}=\frac{3}{4}$. This means that on average, a player scores $\frac{3}{4}$ of a goal for every additional hour of practice.