unit 1 progress check: mcq\nquestions 13 through 15 refer to the following.\na study was conducted to…
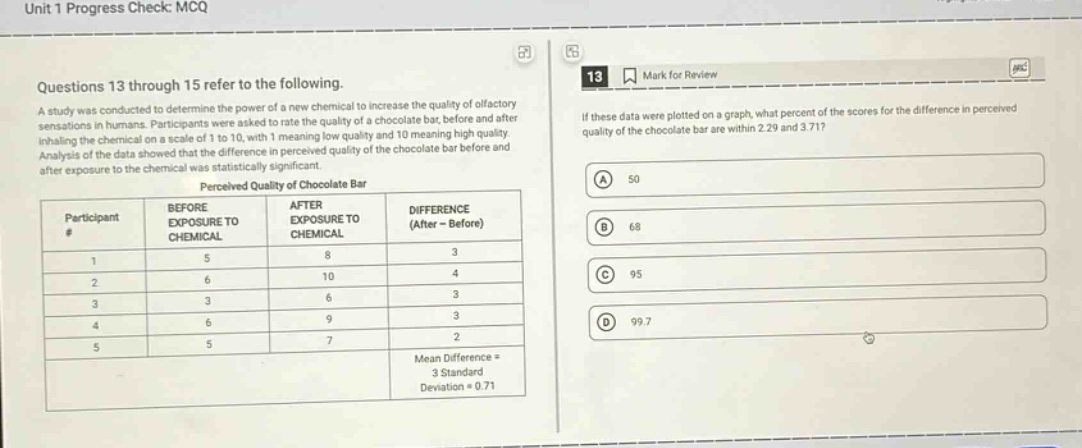
unit 1 progress check: mcq\nquestions 13 through 15 refer to the following.\na study was conducted to determine the power of a new chemical to increase the quality of olfactory sensations in humans. participants were asked to rate the quality of a chocolate bar, before and after inhaling the chemical on a scale of 1 to 10, with 1 meaning low quality and 10 meaning high quality. analysis of the data showed that the difference in perceived quality of the chocolate bar before and after exposure to the chemical was statistically significant.\nperceived quality of chocolate bar\nparticipant # before exposure to chemical after exposure to chemical difference (after - before)\n1 5 8 3\n2 6 10 4\n3 3 6 3\n4 6 9 3\n5 5 7 2\nmean difference = 3 standard deviation = 0.71\n13 mark for review\nif these data were plotted on a graph, what percent of the scores for the difference in perceived quality of the chocolate bar are within 2.29 and 3.71?\n(a) 50\n(b) 68\n(c) 95\n(d) 99.7
Answer
Explanation:
Step1: Recall the empirical rule
In a normal - distribution, approximately 68% of the data lies within 1 standard deviation of the mean, 95% lies within 2 standard deviations of the mean, and 99.7% lies within 3 standard deviations of the mean.
Step2: Calculate the number of standard - deviations
We are given that the mean difference is 3 and the standard deviation is 0.71. We want to find out how many standard deviations 2.29 and 3.71 are from the mean. For the lower value: $\frac{3 - 2.29}{0.71}=\frac{0.71}{0.71}=1$ For the upper value: $\frac{3.71 - 3}{0.71}=\frac{0.71}{0.71}=1$ So, the values 2.29 and 3.71 are 1 standard deviation below and above the mean respectively.
Answer:
B. 68