use the box and whisker plot below to answer the following: last summer, winkys waterpark kept track of the…
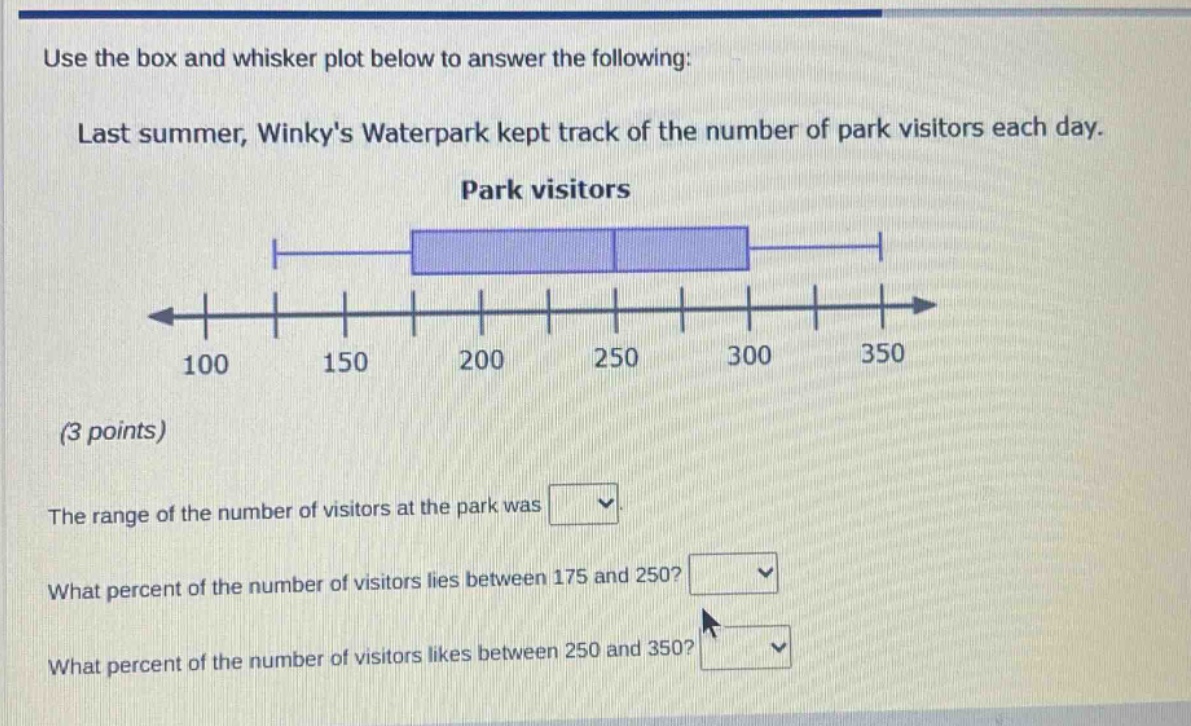
use the box and whisker plot below to answer the following: last summer, winkys waterpark kept track of the number of park visitors each day. park visitors (3 points) the range of the number of visitors at the park was what percent of the number of visitors lies between 175 and 250? what percent of the number of visitors likes between 250 and 350?
Answer
Explanation:
Step1: Identify Key Values from the Box Plot
Read the minimum, first quartile (Q1), median (Q2), third quartile (Q3), and maximum values from the provided box and whisker plot. Minimum = 100 Q1 = 175 Median (Q2) = 250 Q3 = 300 Maximum = 350
Step2: Calculate the Range
The range is the difference between the maximum and minimum values. $$ \text{Range} = \text{Maximum} - \text{Minimum} $$ $$ \text{Range} = 350 - 100 = 250 $$
Step3: Determine the Percentage Between 175 and 250
The box plot divides the data into four quartiles, each representing 25% of the data. The interval from 175 to 250 corresponds to the interval from Q1 to the Median (Q2). $$ \text{Percentage (Q1 to Q2)} = 25% $$
Step4: Determine the Percentage Between 250 and 350
The interval from 250 to 350 corresponds to the interval from the Median (Q2) to the Maximum. This covers the third quartile (Q2 to Q3) and the fourth quartile (Q3 to Maximum). $$ \text{Percentage (Q2 to Max)} = \text{Percentage (Q2 to Q3)} + \text{Percentage (Q3 to Max)} $$ $$ \text{Percentage (Q2 to Max)} = 25% + 25% = 50% $$
Answer:
The range of the number of visitors at the park was 250. What percent of the number of visitors lies between 175 and 250? 25% What percent of the number of visitors likes between 250 and 350? 50%