use the data set below for problems 1 - 6.\n58, 71, 51, 67, 58, 55, 53, 57, 58, 62, 65\n1. what is the…
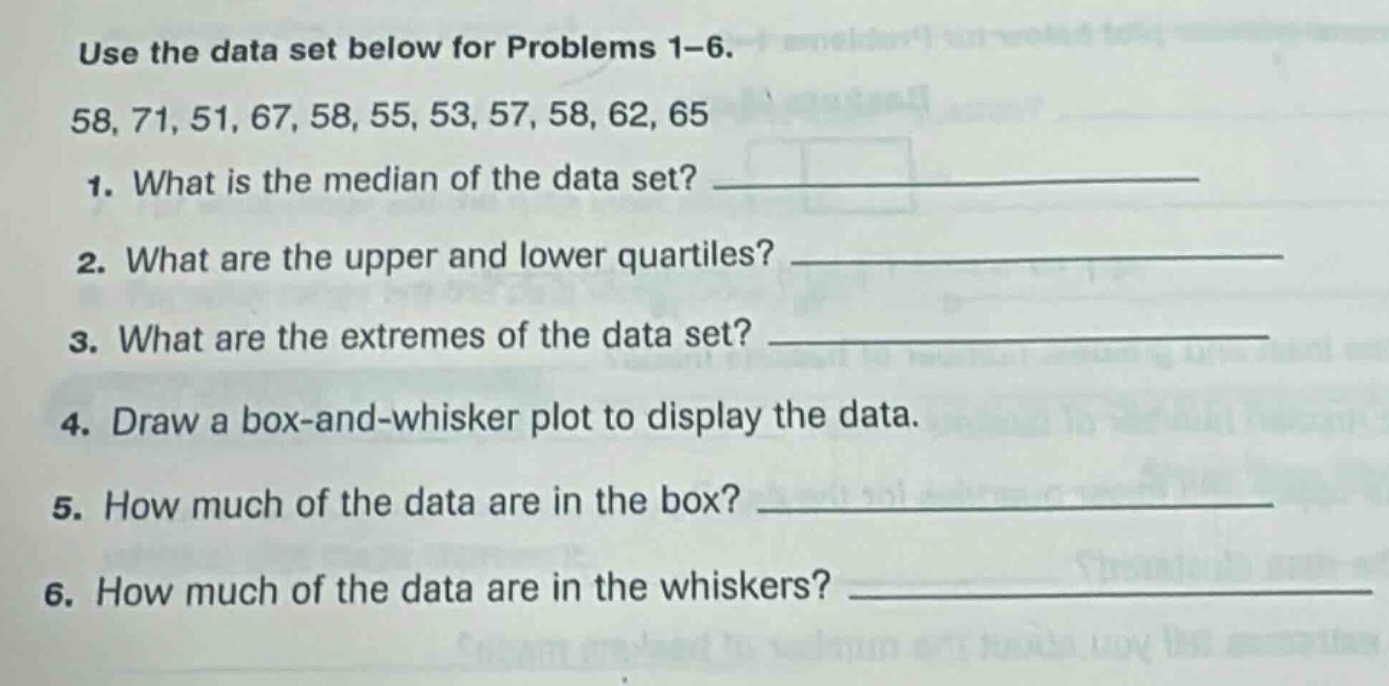
use the data set below for problems 1 - 6.\n58, 71, 51, 67, 58, 55, 53, 57, 58, 62, 65\n1. what is the median of the data set? \n2. what are the upper and lower quartiles? \n3. what are the extremes of the data set? \n4. draw a box - and - whisker plot to display the data.\n5. how much of the data are in the box? \n6. how much of the data are in the whiskers?
Answer
Explanation:
Step1: Ordenar el conjunto de datos
51, 53, 55, 57, 58, 58, 58, 62, 65, 67, 71
Step2: Encontrar la mediana
Hay 11 datos. El índice de la mediana es $\frac{11 + 1}{2}=6$. La mediana es 58.
Step3: Encontrar los cuartiles
El sub - conjunto inferior es 51, 53, 55, 57, 58. El índice de $Q_1$ es $\frac{5+1}{2}=3$. Entonces $Q_1 = 55$. El sub - conjunto superior es 58, 62, 65, 67, 71. El índice de $Q_3$ es $\frac{5 + 1}{2}=3$. Entonces $Q_3=65$.
Step4: Encontrar los extremos
El mínimo es 51 y el máximo es 71.
Step5: Respuesta para la cantidad de datos en la caja
En un diagrama de caja y bigotes, la caja representa el 50% de los datos (entre $Q_1$ y $Q_3$).
Step6: Respuesta para la cantidad de datos en las barbas
Las barbas representan el 50% de los datos (el 25% menor que $Q_1$ y el 25% mayor que $Q_3$).
Answer:
- 58
- $Q_1 = 55$, $Q_3=65$
- Mínimo: 51, Máximo: 71
- (No se puede dibujar en este formato, pero se construye con los valores de mínimo, $Q_1$, mediana, $Q_3$ y máximo)
- 50%
- 50%