use the data set in the scatter plot shown to answer the question. what is the best estimate of the…
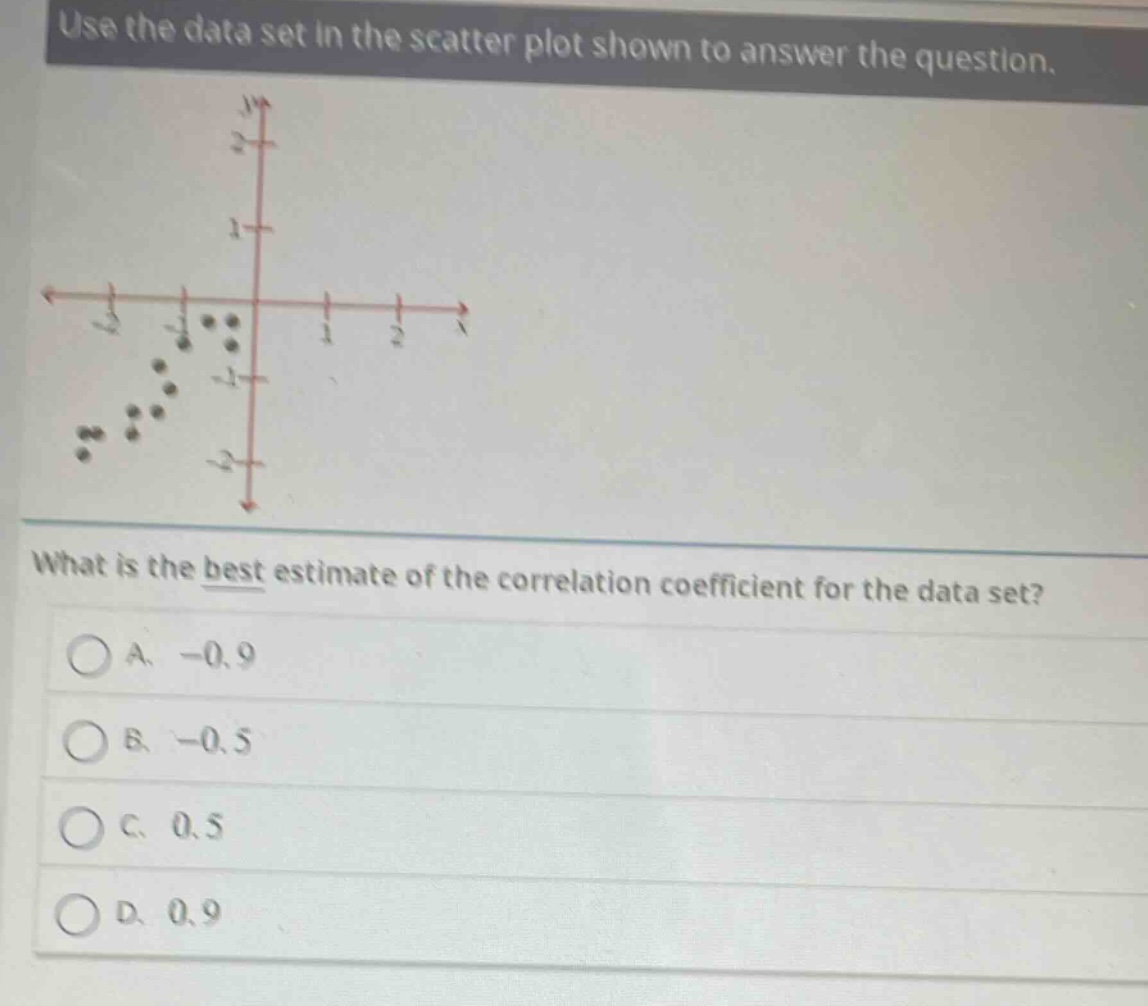
use the data set in the scatter plot shown to answer the question. what is the best estimate of the correlation coefficient for the data set? a. -0.9 b. -0.5 c. 0.5 d. 0.9
Answer
Explanation:
Step1: Observe scatter - plot direction
The points in the scatter - plot are sloping downwards from left to right, indicating a negative correlation. So, we can rule out options C and D which are positive values.
Step2: Observe scatter - plot tightness
The points are closely clustered around a line, suggesting a strong correlation. A correlation coefficient of - 0.5 indicates a moderate negative correlation, while a value of - 0.9 indicates a strong negative correlation. Since the points are tightly grouped, the correlation is strong.
Answer:
A. -0.9