use the data set in the scatter - plot shown to answer the question. what is the best estimate of the…
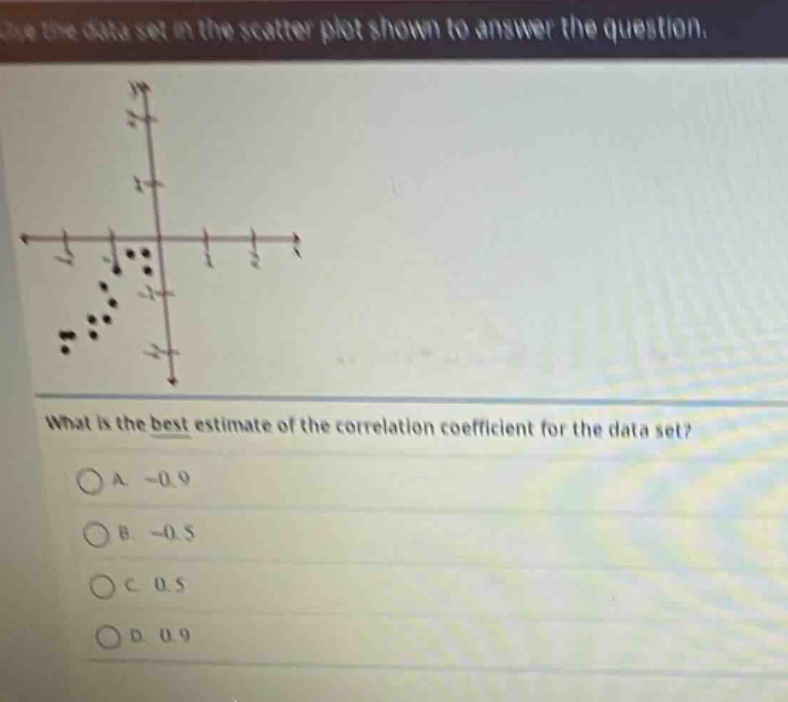
use the data set in the scatter - plot shown to answer the question. what is the best estimate of the correlation coefficient for the data set? a -0.9 b -0.5 c 0.5 d 0.9
Answer
Explanation:
Step1: Observe the scatter - plot direction
The points in the scatter - plot are sloping downwards from left to right, indicating a negative correlation. So, we can rule out options C and D which represent positive correlations.
Step2: Assess the strength of the correlation
The points in the scatter - plot are closely clustered around an imaginary line. A correlation coefficient of - 0.5 would indicate a moderate negative correlation with points more spread out, while a correlation coefficient of - 0.9 indicates a strong negative correlation with points closely grouped. Since the points here are closely grouped, the correlation is strong.
Answer:
A. -0.9