use the display of data to find the mean, median, mode, and midrange. the mean of the data is. (round to the…
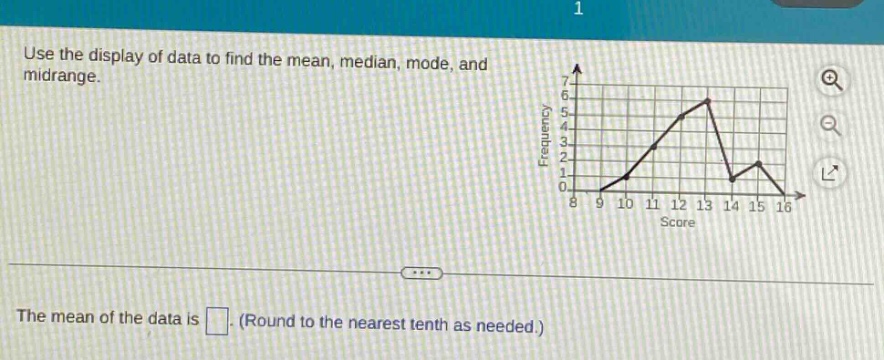
use the display of data to find the mean, median, mode, and midrange. the mean of the data is. (round to the nearest tenth as needed.)
Answer
Explanation:
Step1: Find the data - frequency pairs
From the graph:
- Score 9 has frequency 1
- Score 10 has frequency 1
- Score 11 has frequency 3
- Score 12 has frequency 4
- Score 13 has frequency 5
- Score 14 has frequency 6
- Score 15 has frequency 2
- Score 16 has frequency 1
Step2: Calculate the sum of the products of scores and frequencies
[ \begin{align*} \sum_{i}x_if_i&=(9\times1)+(10\times1)+(11\times3)+(12\times4)+(13\times5)+(14\times6)+(15\times2)+(16\times1)\ &=9 + 10+33+48+65+84+30+16\ &=295 \end{align*} ]
Step3: Calculate the total frequency
[ \begin{align*} n&=1 + 1+3+4+5+6+2+1\ &=23 \end{align*} ]
Step4: Calculate the mean
The mean $\bar{x}=\frac{\sum_{i}x_if_i}{n}=\frac{295}{23}\approx12.8$
Step5: Find the median
Since $n = 23$ (odd), the median is the $\left(\frac{n + 1}{2}\right)$-th value. $\frac{23+1}{2}=12$-th value. Counting the frequencies: $1+1+3+4 = 9$ (first 9 values), and adding the frequency of 13 (5 values), we get to the 14 - th value when considering scores up to 13. So the median is 13.
Step6: Find the mode
The mode is the score with the highest frequency. The score 14 has the highest frequency of 6, so the mode is 14.
Step7: Find the mid - range
The mid - range is $\frac{\text{Minimum value}+\text{Maximum value}}{2}=\frac{9 + 16}{2}=\frac{25}{2}=12.5$
Answer:
Mean: 12.8 Median: 13 Mode: 14 Mid - range: 12.5