use the display of data to find the mean, median, mode, and midrange.\nthe mean of the data is . (round to…
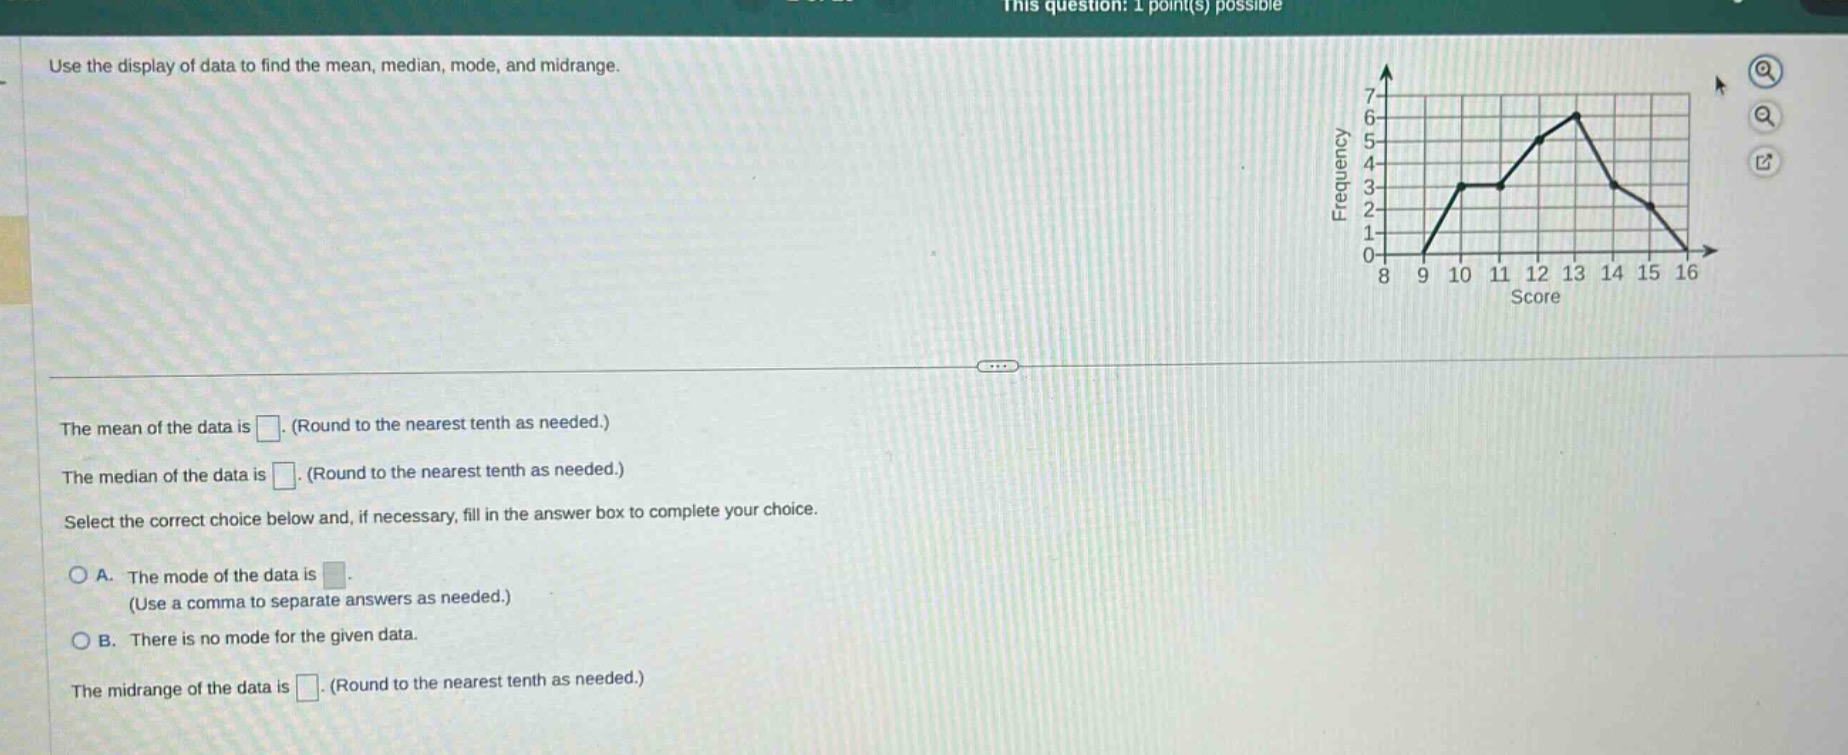
use the display of data to find the mean, median, mode, and midrange.\nthe mean of the data is . (round to the nearest tenth as needed.)\nthe median of the data is . (round to the nearest tenth as needed.)\nselect the correct choice below and, if necessary, fill in the answer box to complete your choice.\na. the mode of the data is . (use a comma to separate answers as needed.)\nb. there is no mode for the given data.\nthe midrange of the data is . (round to the nearest tenth as needed.)
Answer
Explanation:
Step1: Calculate the sum of data - frequency products
First, list out the scores and their frequencies from the graph: Score 9 with frequency 1, score 10 with frequency 3, score 11 with frequency 3, score 12 with frequency 5, score 13 with frequency 6, score 14 with frequency 3, score 15 with frequency 2. The sum of data - frequency products is (9\times1 + 10\times3+11\times3 + 12\times5+13\times6+14\times3+15\times2) [=9+30 + 33+60+78+42+30] [=282]
Step2: Calculate the total frequency
The total frequency is (1 + 3+3+5+6+3+2=23)
Step3: Calculate the mean
The mean (\bar{x}=\frac{\sum_{i = 1}^{n}x_if_i}{\sum_{i = 1}^{n}f_i}), where (x_i) are the data - values and (f_i) are their frequencies. So the mean (\bar{x}=\frac{282}{23}\approx12.3)
Step4: Find the median
Since (n = 23) (odd), the median is the (\left(\frac{n + 1}{2}\right))-th value. (\frac{23+1}{2}=12)-th value. Counting the frequencies: (1+3+3 = 7) (first three scores), and (1 + 3+3+5=12) (including score 12). So the median is 12.
Step5: Find the mode
The mode is the value with the highest frequency. The score of 13 has the highest frequency of 6. So the mode is 13.
Step6: Calculate the mid - range
The mid - range is (\frac{\text{Minimum value}+\text{Maximum value}}{2}). The minimum value is 9 and the maximum value is 15. So the mid - range is (\frac{9 + 15}{2}=12)
Answer:
The mean of the data is (12.3). The median of the data is (12). A. The mode of the data is (13). The midrange of the data is (12).