use the display of data to find the standard deviation.\nthe standard deviation is \n(type an integer or…
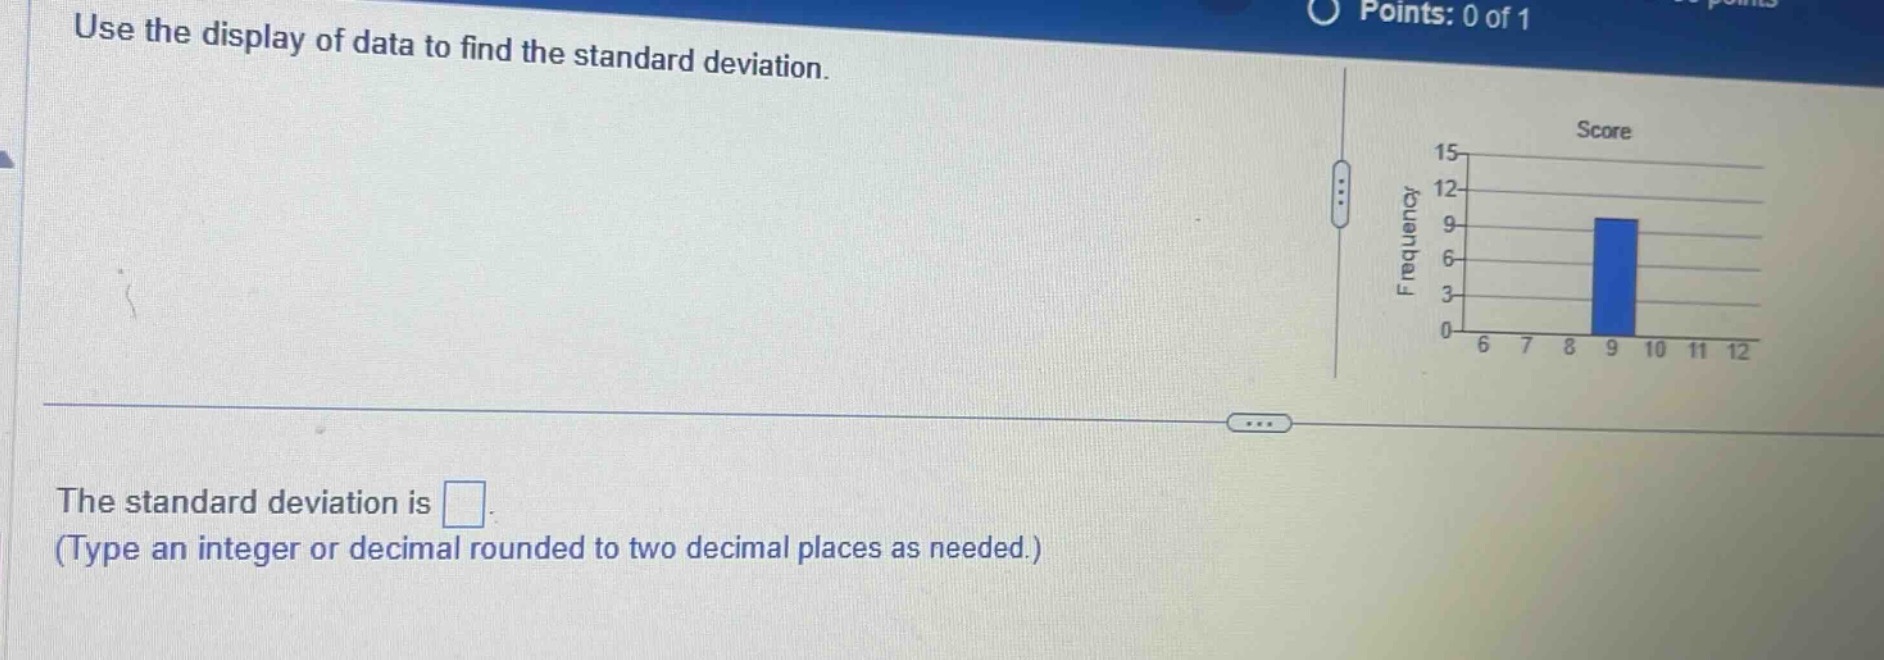
use the display of data to find the standard deviation.\nthe standard deviation is \n(type an integer or decimal rounded to two decimal places as needed.)
Answer
Explanation:
Step1: Identify data - values and frequencies
From the bar - chart, the data value $x = 9$ has frequency $f=9$. There is only one non - zero frequency value, so $n=\sum f = 9$. The mean $\mu$ of a single data value with frequency $n$ is just the data value itself, so $\mu = 9$.
Step2: Calculate the squared - deviation
The formula for the squared - deviation $(x_i-\mu)^2$ for our single data value $x = 9$ and $\mu = 9$ is $(9 - 9)^2=0$.
Step3: Calculate the variance
The formula for the variance $s^2=\frac{\sum_{i = 1}^{k}f_i(x_i-\mu)^2}{n - 1}$. Since $(x - \mu)^2=0$ and $f = 9$, then $s^2=\frac{9\times(9 - 9)^2}{9 - 1}=\frac{9\times0}{8}=0$.
Step4: Calculate the standard deviation
The standard deviation $s=\sqrt{s^2}$. Since $s^2 = 0$, then $s = 0$.
Answer:
$0.00$