use the graph to complete the following. the probability that a boxer weighs between 60 and 80 pounds is %
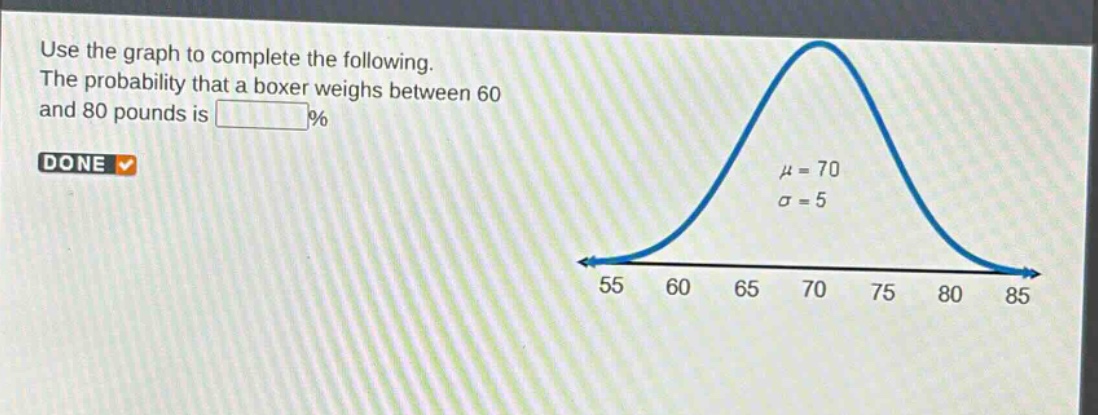
use the graph to complete the following. the probability that a boxer weighs between 60 and 80 pounds is %
Answer
Answer:
95
Explanation:
Step1: Recall normal - distribution property
In a normal distribution, about 95% of the data lies within 2 standard deviations of the mean.
Step2: Calculate standard - deviation intervals
The mean $\mu = 70$ and standard deviation $\sigma=5$. The interval from 60 to 80 is $\mu - 2\sigma$ to $\mu + 2\sigma$ since $70-2\times5 = 60$ and $70 + 2\times5=80$. So the probability that a boxer weighs between 60 and 80 pounds is 95%.