use the graph of the scatter plot to answer the question. based on the graph, what would be the slope for…
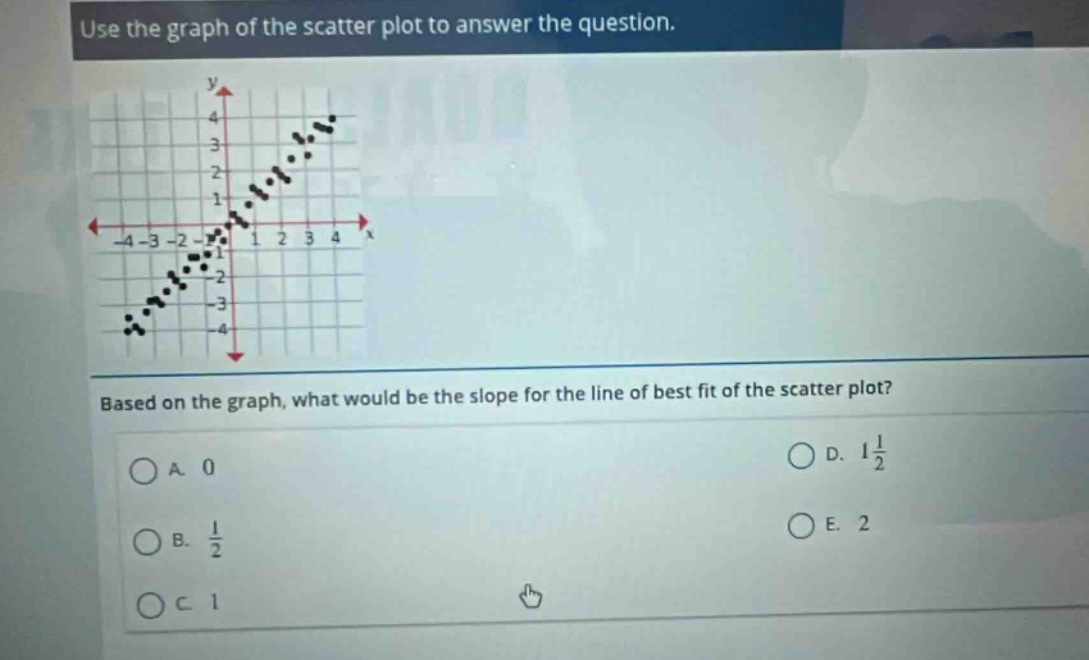
use the graph of the scatter plot to answer the question. based on the graph, what would be the slope for the line of best fit of the scatter plot? a. 0 b. $\frac{1}{2}$ c. 1 d. $1\frac{1}{2}$ e. 2
Answer
Explanation:
Step1: Recall slope - formula concept
The slope of a line $m=\frac{\Delta y}{\Delta x}$. For a line of best - fit in a scatter - plot, we can estimate it by looking at the general trend.
Step2: Observe the scatter - plot trend
As $x$ increases by 1 unit, $y$ also seems to increase by 1 unit. For example, if we consider two approximate points on the line of best - fit like $(0,0)$ and $(1,1)$.
Step3: Calculate the slope
Using the slope formula $m = \frac{y_2 - y_1}{x_2 - x_1}$, with $(x_1,y_1)=(0,0)$ and $(x_2,y_2)=(1,1)$, we have $m=\frac{1 - 0}{1 - 0}=1$.
Answer:
C. 1