use the graphing calculator tool to plot the residual points.\n(1, 0.86), (2, -0.25), (3, -1.66), (4…
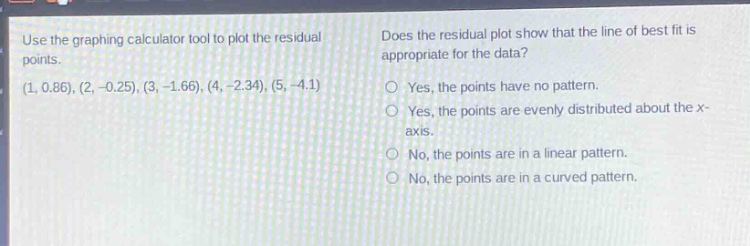
use the graphing calculator tool to plot the residual points.\n(1, 0.86), (2, -0.25), (3, -1.66), (4, -2.34), (5, -4.1)\ndoes the residual plot show that the line of best fit is appropriate for the data?\no yes, the points have no pattern.\no yes, the points are evenly distributed about the x - axis.\no no, the points are in a linear pattern.\no no, the points are in a curved pattern.
Answer
Brief Explanations:
A good residual plot for a well - fitting line of best fit has points randomly scattered with no pattern. If there is a linear or curved pattern in the residual plot, it indicates that the line of best fit is not appropriate as it means there is some underlying structure in the data that the current linear model is not capturing.
Answer:
If the points in the residual plot have a linear or curved pattern, the line of best fit is not appropriate. So, if the points are in a linear pattern or in a curved pattern, the answer is "No". If the points have no pattern or are evenly distributed about the x - axis, the answer is "Yes". Without actually seeing the plot, we can't determine the exact answer from the given options, but the correct reasoning for determining the appropriateness of the line of best fit based on the residual plot is as described above. If we assume we are choosing from the given options based on the rules of residual plots, if there is a linear pattern in the points of the residual plot, the answer is: No, the points are in a linear pattern.