use the information in the table to answer the question.\n| species | mean | standard deviation |\n| ---- |…
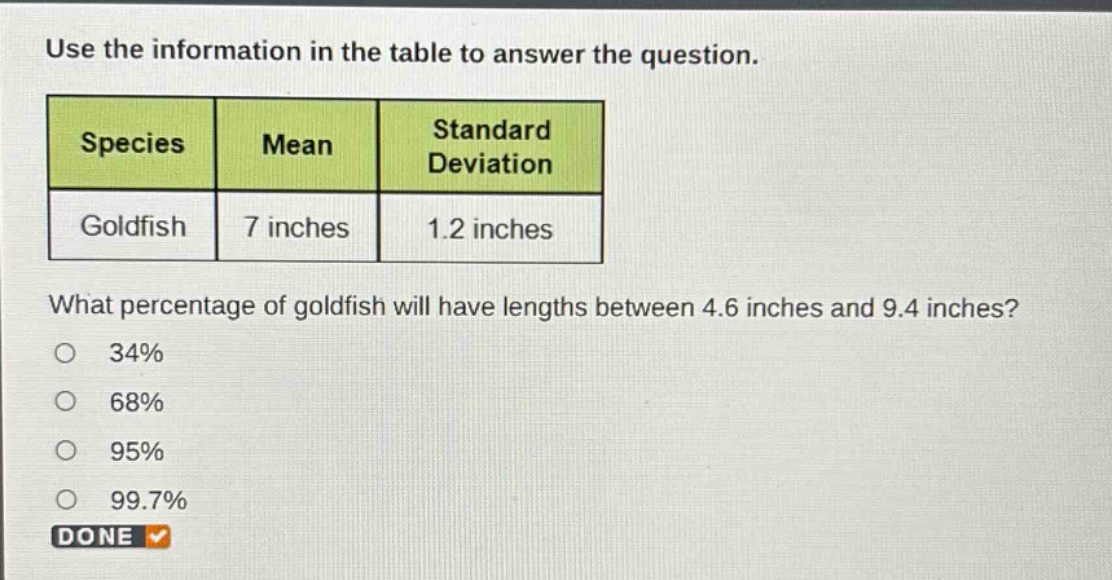
use the information in the table to answer the question.\n| species | mean | standard deviation |\n| ---- | ---- | ---- |\n| goldfish | 7 inches | 1.2 inches |\nwhat percentage of goldfish will have lengths between 4.6 inches and 9.4 inches?\n34%\n68%\n95%\n99.7%\ndone
Answer
Answer:
C. 95%
Explanation:
Step1: Calculate z - scores
For (x = 4.6), (z_1=\frac{4.6 - 7}{1.2}=\frac{- 2.4}{1.2}=- 2) For (x = 9.4), (z_2=\frac{9.4 - 7}{1.2}=\frac{2.4}{1.2}=2)
Step2: Use the empirical rule
The empirical rule for a normal - distribution states that approximately 95% of the data lies within (z=-2) and (z = 2) standard deviations of the mean. So the percentage of goldfish with lengths between 4.6 inches and 9.4 inches is 95%.