use the information in the table to complete the statements.\n| age | mean | standard deviation |\n| ---- |…
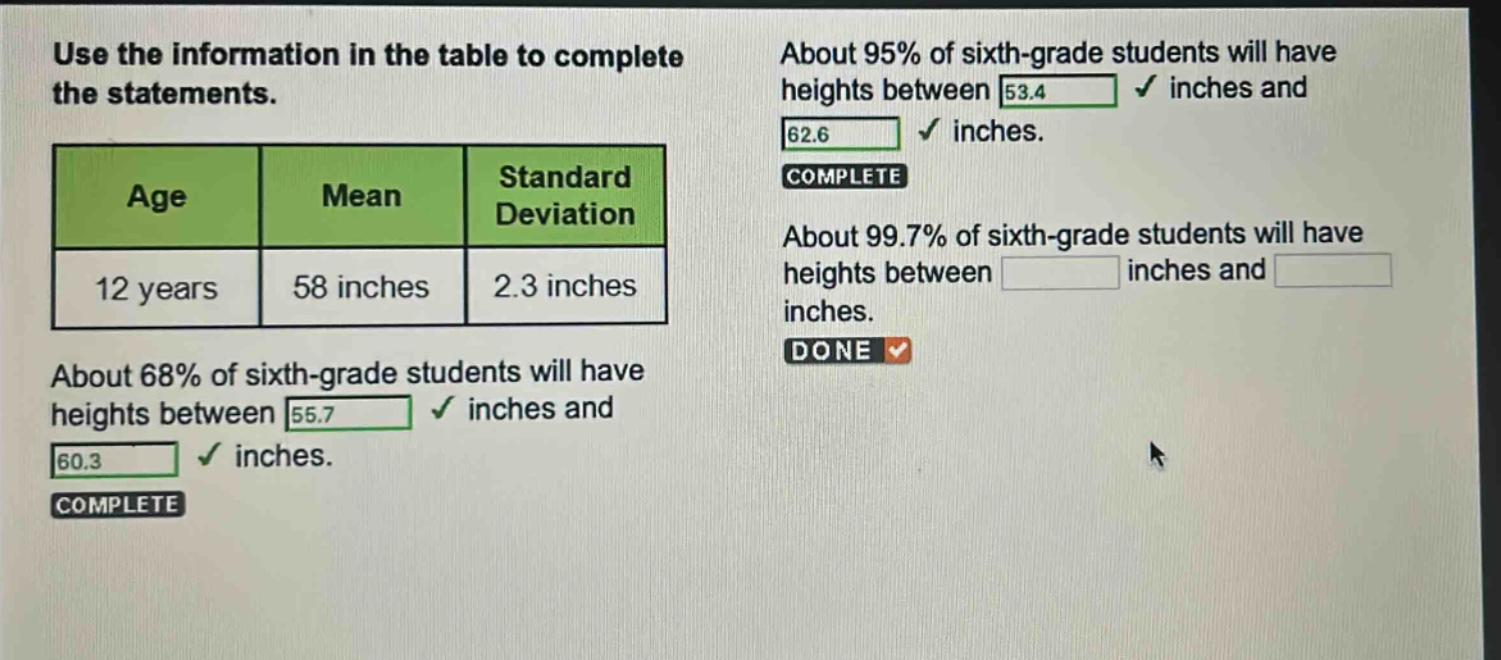
use the information in the table to complete the statements.\n| age | mean | standard deviation |\n| ---- | ---- | ---- |\n| 12 years | 58 inches | 2.3 inches |\nabout 68% of sixth - grade students will have heights between 55.7 inches and 60.3 inches. complete\nabout 95% of sixth - grade students will have heights between 53.4 inches and 62.6 inches. complete\nabout 99.7% of sixth - grade students will have heights between inches and inches. done
Answer
Explanation:
Step1: Recall the empirical rule
In a normal - distribution, about 99.7% of the data lies within 3 standard deviations of the mean.
Step2: Calculate the lower bound
The mean $\mu = 58$ inches and the standard deviation $\sigma=2.3$ inches. The lower bound is $\mu - 3\sigma=58-3\times2.3=58 - 6.9 = 51.1$ inches.
Step3: Calculate the upper bound
The upper bound is $\mu + 3\sigma=58 + 3\times2.3=58+6.9 = 64.9$ inches.
Answer:
51.1, 64.9