use the number line to identify the least value, first quartile, median, third quartile, and greatest value…
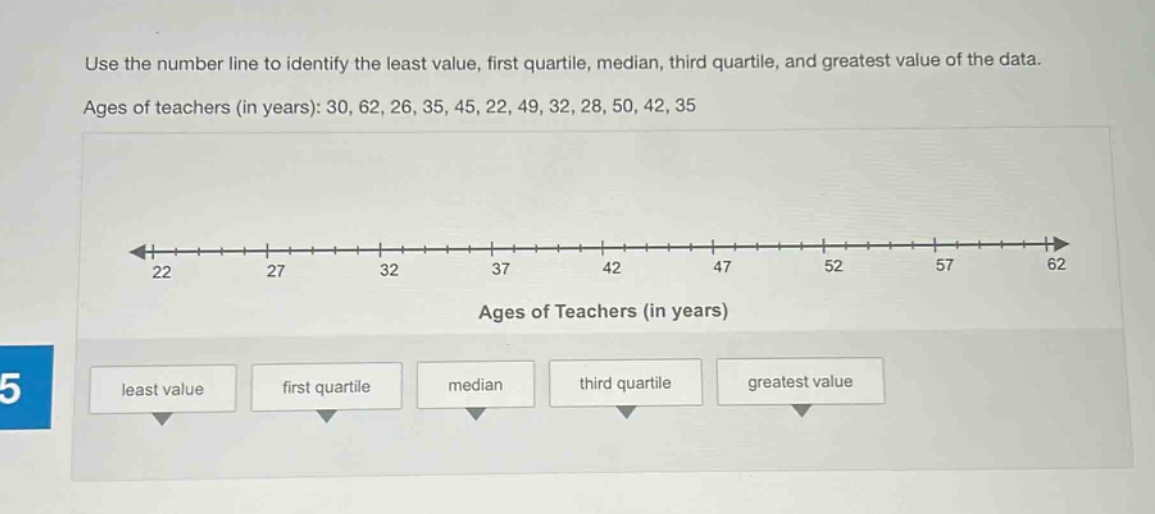
use the number line to identify the least value, first quartile, median, third quartile, and greatest value of the data. ages of teachers (in years): 30, 62, 26, 35, 45, 22, 49, 32, 28, 50, 42, 35
Answer
Explanation:
Step1: Arrange data in ascending order
22, 26, 28, 30, 32, 35, 35, 42, 45, 49, 50, 62
Step2: Find the least value
The least value is the smallest number in the data - set. So, the least value is 22.
Step3: Find the number of data points
There are (n = 12) data points.
Step4: Calculate the median
Since (n = 12) (an even - numbered data set), the median is the average of the (\frac{n}{2})th and ((\frac{n}{2}+1))th ordered values. (\frac{n}{2}=6) and (\frac{n}{2}+1 = 7). The 6th value is 35 and the 7th value is 35. Median(=\frac{35 + 35}{2}=35).
Step5: Calculate the first quartile
The first quartile (Q_1) is the median of the lower half of the data. The lower half of the data is 22, 26, 28, 30, 32, 35. Since there are 6 data points (an even - numbered set), (Q_1=\frac{28+30}{2}=29).
Step6: Calculate the third quartile
The third quartile (Q_3) is the median of the upper half of the data. The upper half of the data is 42, 45, 49, 50, 62. Since there are 6 data points (an even - numbered set), (Q_3=\frac{45 + 49}{2}=47).
Step7: Find the greatest value
The greatest value is the largest number in the data - set. So, the greatest value is 62.
Answer:
Least value: 22 First quartile: 29 Median: 35 Third quartile: 47 Greatest value: 62