use the regression line for the data in the scatterplot to answer the question. on average, how many more…
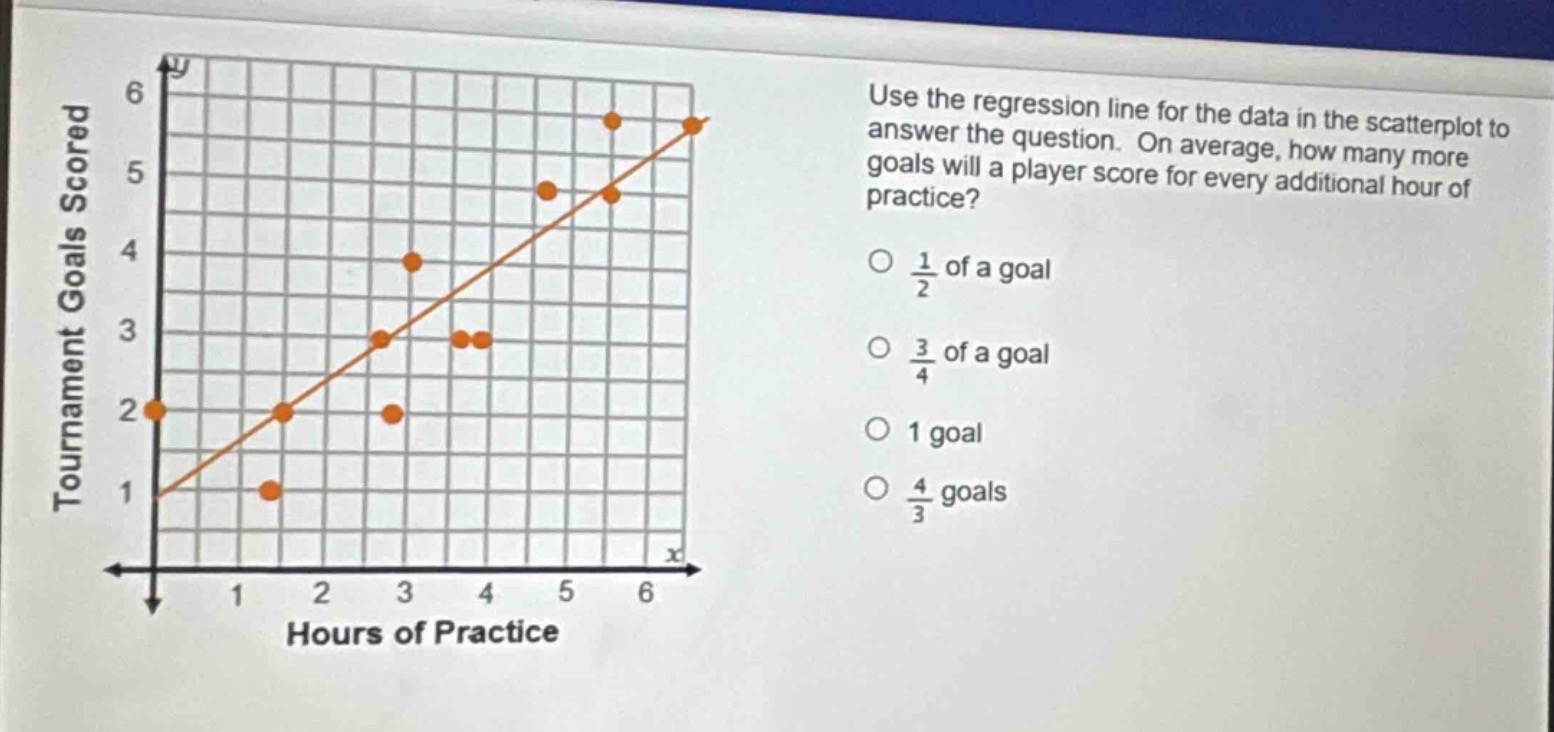
use the regression line for the data in the scatterplot to answer the question. on average, how many more goals will a player score for every additional hour of practice?\n○ $\frac{1}{2}$ of a goal\n○ $\frac{3}{4}$ of a goal\n○ 1 goal\n○ $\frac{4}{3}$ goals
Answer
Explanation:
Step1: Recall slope - meaning
The slope of the regression line represents the change in the dependent variable (goals scored) for a one - unit change in the independent variable (hours of practice).
Step2: Select two points on the line
Let's take two points on the regression line, say (0,1) and (2,2).
Step3: Calculate the slope
The slope formula is $m=\frac{y_2 - y_1}{x_2 - x_1}$. Here, $x_1 = 0,y_1 = 1,x_2=2,y_2 = 2$. So $m=\frac{2 - 1}{2-0}=\frac{1}{2}$.
Answer:
$\frac{1}{2}$ of a goal