use the relative frequency histogram below to complete each part. (a) identify the class with the greatest…
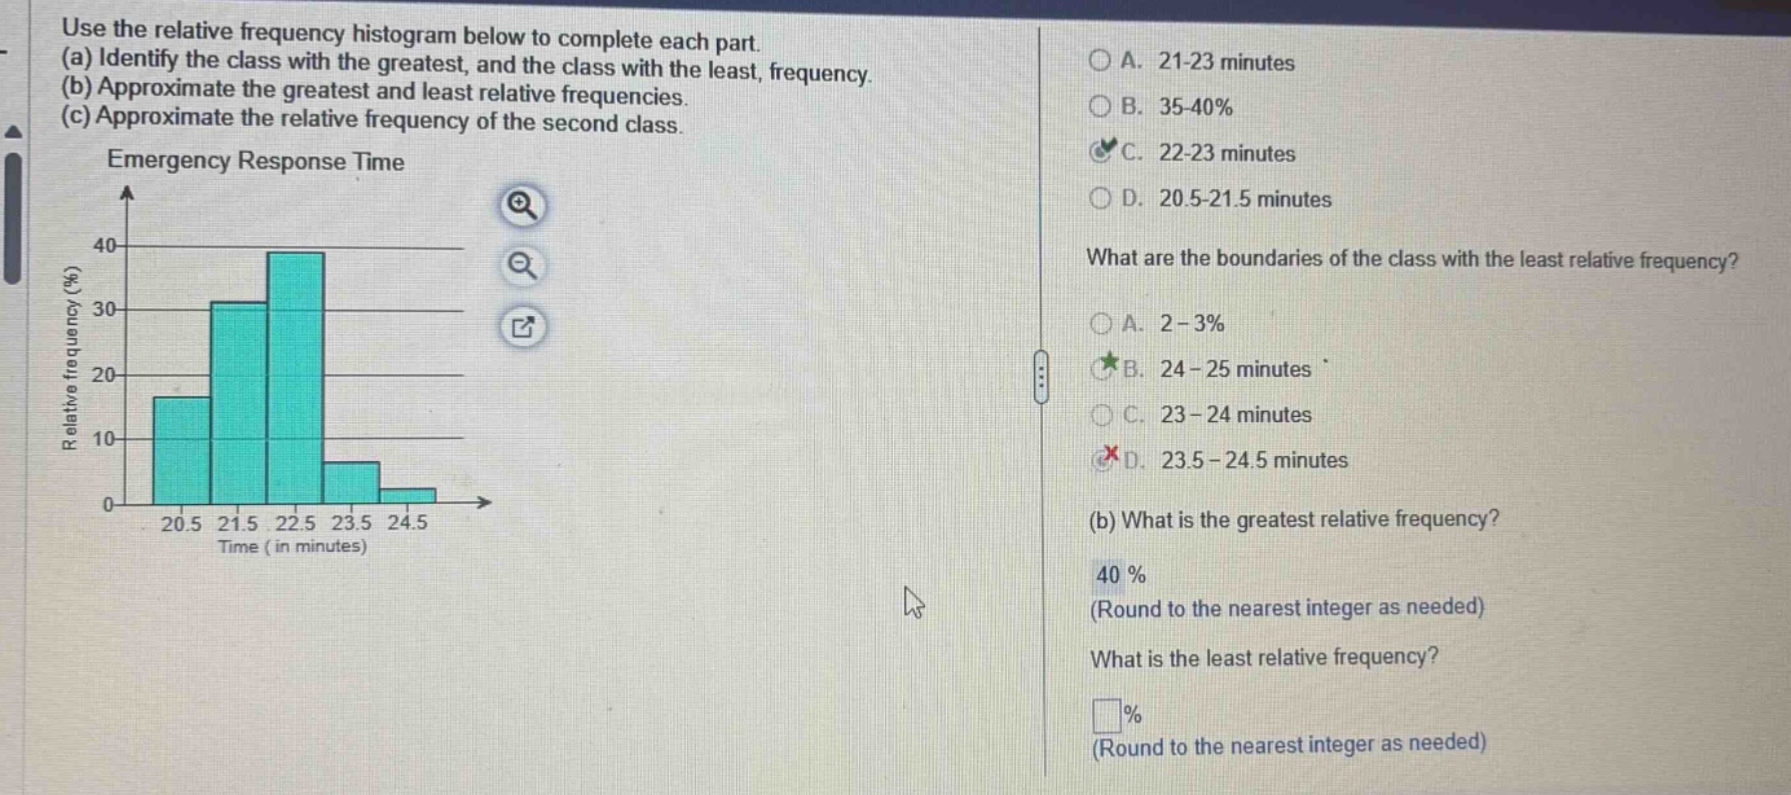
use the relative frequency histogram below to complete each part. (a) identify the class with the greatest, and the class with the least, frequency. (b) approximate the greatest and least relative frequencies. (c) approximate the relative frequency of the second class. emergency response time what are the boundaries of the class with the least relative frequency? (b) what is the greatest relative frequency? 40 % (round to the nearest integer as needed) what is the least relative frequency? % (round to the nearest integer as needed)
Answer
Explanation:
Step1: Identify class with greatest frequency
The tallest bar in the histogram is for the class 22 - 23 minutes (22.5 - 23.5 on the x - axis), so the class with the greatest frequency has boundaries 22 - 23 minutes.
Step2: Identify class with least frequency
The shortest non - zero bar is for the class 24 - 25 minutes (24.5 on the x - axis), so the class with the least frequency has boundaries 24 - 25 minutes.
Step3: Determine greatest relative frequency
The height of the tallest bar is approximately 40%, so the greatest relative frequency is 40%.
Step4: Determine least relative frequency
The height of the shortest non - zero bar is approximately 5%, so the least relative frequency is 5%.
Step5: Approximate relative frequency of second class
The second class is from 21.5 - 22.5 minutes. Its relative frequency is approximately 30%.
Answer:
(a) Class with greatest frequency: C. 22 - 23 minutes; Class with least frequency: B. 24 - 25 minutes (b) Greatest relative frequency: 40%; Least relative frequency: 5% (c) Relative frequency of second class: 30%