use the scatter plot to answer the question.\nwhat is the best estimate for the correlation coefficient of…
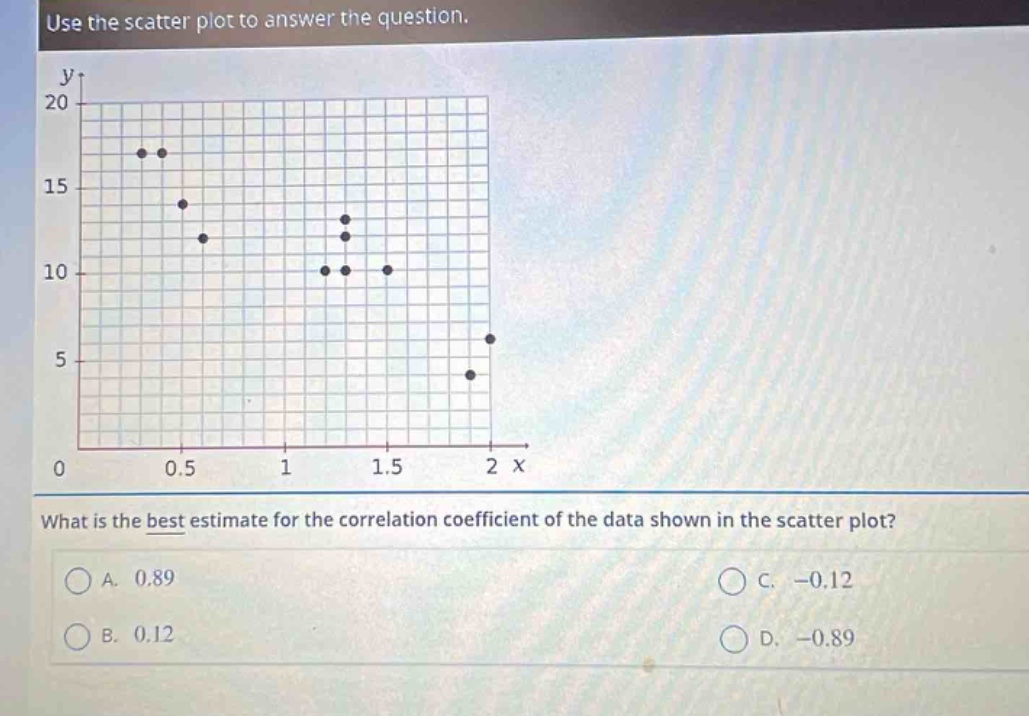
use the scatter plot to answer the question.\nwhat is the best estimate for the correlation coefficient of the data shown in the scatter plot?\na. 0.89\nb. 0.12\nc. -0.12\nd. -0.89
Answer
Answer:
C. -0.12
Explanation:
Step1: Observe the scatter - plot
The points are scattered randomly with no clear upward or downward trend.
Step2: Recall correlation coefficient concept
A positive correlation coefficient indicates an upward trend, a negative one indicates a downward trend, and near - zero indicates no linear relationship. Since there is no linear trend here, the correlation coefficient should be close to 0. Among the options, - 0.12 is closest to 0.