use the scatter plot to answer the question. a concession stand sells smoothies. the scatter plot shows the…
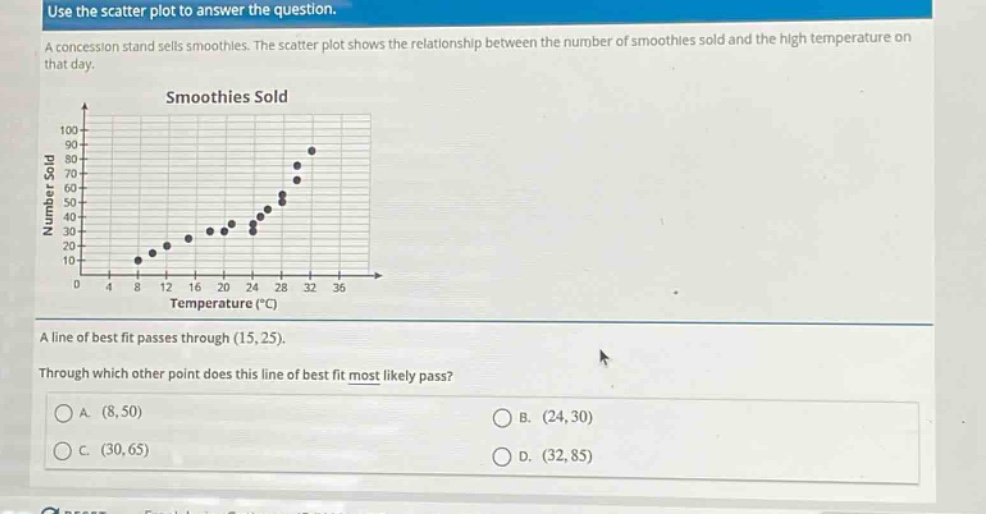
use the scatter plot to answer the question. a concession stand sells smoothies. the scatter plot shows the relationship between the number of smoothies sold and the high temperature on that day. a line of best fit passes through (15,25). through which other point does this line of best fit most likely pass? a. (8,50) b. (24,30) c. (30,65) d. (32,85)
Answer
Answer:
C. (30,65)
Explanation:
Step1: Analyze scatter - plot trend
The scatter - plot shows a positive linear relationship between temperature and number of smoothies sold. As temperature increases, the number of smoothies sold also increases.
Step2: Check each option
For option A (8,50), when the temperature is 8°C, the number of smoothies sold in the scatter - plot is much less than 50, so this point is not likely on the line of best fit. For option B (24,30), looking at the scatter - plot, when the temperature is 24°C, the number of smoothies sold is higher than 30, so this point is not likely on the line of best fit. For option C (30,65), considering the upward trend of the scatter - plot and the fact that the line of best fit passes through (15,25), this point is in line with the overall upward trend and is a likely point on the line of best fit. For option D (32,85), although the trend is upward, this point seems too high compared to the general trend of the scatter - plot points, so it is not likely on the line of best fit.