use the table to find the residual points.\n| x | given | predicted | residual |\n|----|----|----|----|\n| 1…
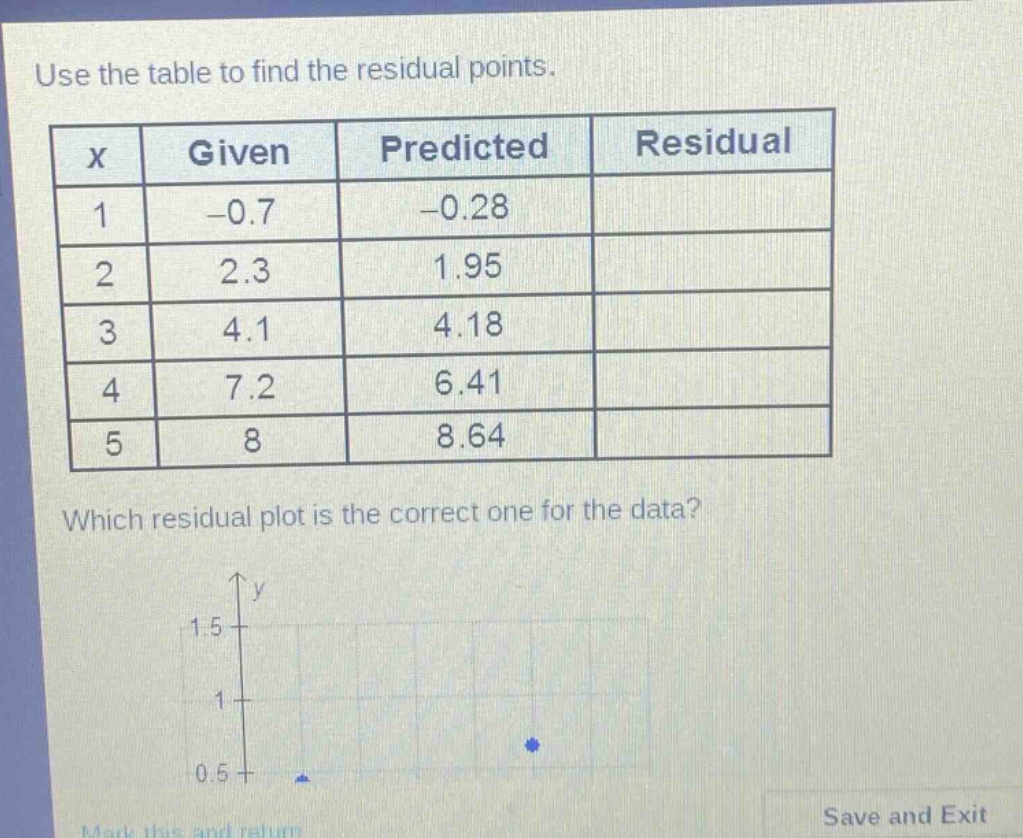
use the table to find the residual points.\n| x | given | predicted | residual |\n|----|----|----|----|\n| 1 | -0.7 | -0.28 | |\n| 2 | 2.3 | 1.95 | |\n| 3 | 4.1 | 4.18 | |\n| 4 | 7.2 | 6.41 | |\n| 5 | 8 | 8.64 | |\nwhich residual plot is the correct one for the data?
Answer
Explanation:
Step1: Recall residual formula
Residual = Given - Predicted
Step2: Calculate residual for x = 1
Residual = - 0.7-(-0.28)=-0.7 + 0.28=-0.42
Step3: Calculate residual for x = 2
Residual = 2.3 - 1.95 = 0.35
Step4: Calculate residual for x = 3
Residual = 4.1 - 4.18=-0.08
Step5: Calculate residual for x = 4
Residual = 7.2 - 6.41 = 0.79
Step6: Calculate residual for x = 5
Residual = 8 - 8.64=-0.64
The completed table with residuals:
| x | Given | Predicted | Residual |
|---|---|---|---|
| 1 | -0.7 | -0.28 | -0.42 |
| 2 | 2.3 | 1.95 | 0.35 |
| 3 | 4.1 | 4.18 | -0.08 |
| 4 | 7.2 | 6.41 | 0.79 |
| 5 | 8 | 8.64 | -0.64 |
Since the question about which residual - plot is correct is not fully provided (no other plots are shown), we can only provide the calculated residuals.
Answer:
The residuals are - 0.42, 0.35, - 0.08, 0.79, - 0.64 for x = 1, 2, 3, 4, 5 respectively.