using the data, create a histogram. for this histogram, each bin excludes the left endpoint and includes the…
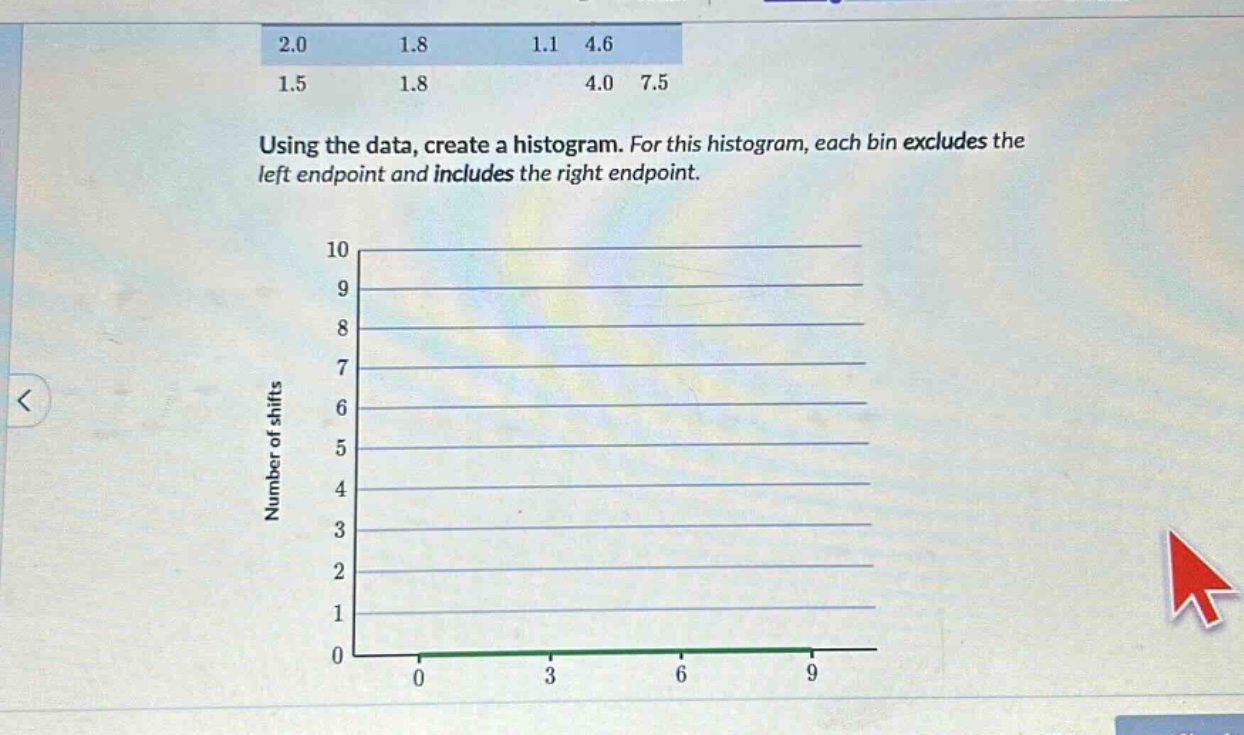
using the data, create a histogram. for this histogram, each bin excludes the left endpoint and includes the right endpoint.
Answer
Explanation:
Step1: Determine bin - ranges
Let's choose bin - ranges: 0 - 3, 3 - 6, 6 - 9.
Step2: Count data points in each bin
For the bin 0 - 3: The data points 1.1, 1.5, 1.8, 1.8, 2.0 fall in this range. So, the frequency is 5. For the bin 3 - 6: The data points 4.0, 4.6 fall in this range. So, the frequency is 2. For the bin 6 - 9: The data point 7.5 falls in this range. So, the frequency is 1.
Step3: Draw the histogram
On the x - axis, mark the bin - ranges (0 - 3, 3 - 6, 6 - 9). On the y - axis, mark the frequencies. Draw bars with heights corresponding to the frequencies for each bin.
Answer:
A histogram with bin - ranges 0 - 3 (frequency 5), 3 - 6 (frequency 2), and 6 - 9 (frequency 1) is drawn.