using the data below, eve created a conditional relative frequency table by column and bob created a…
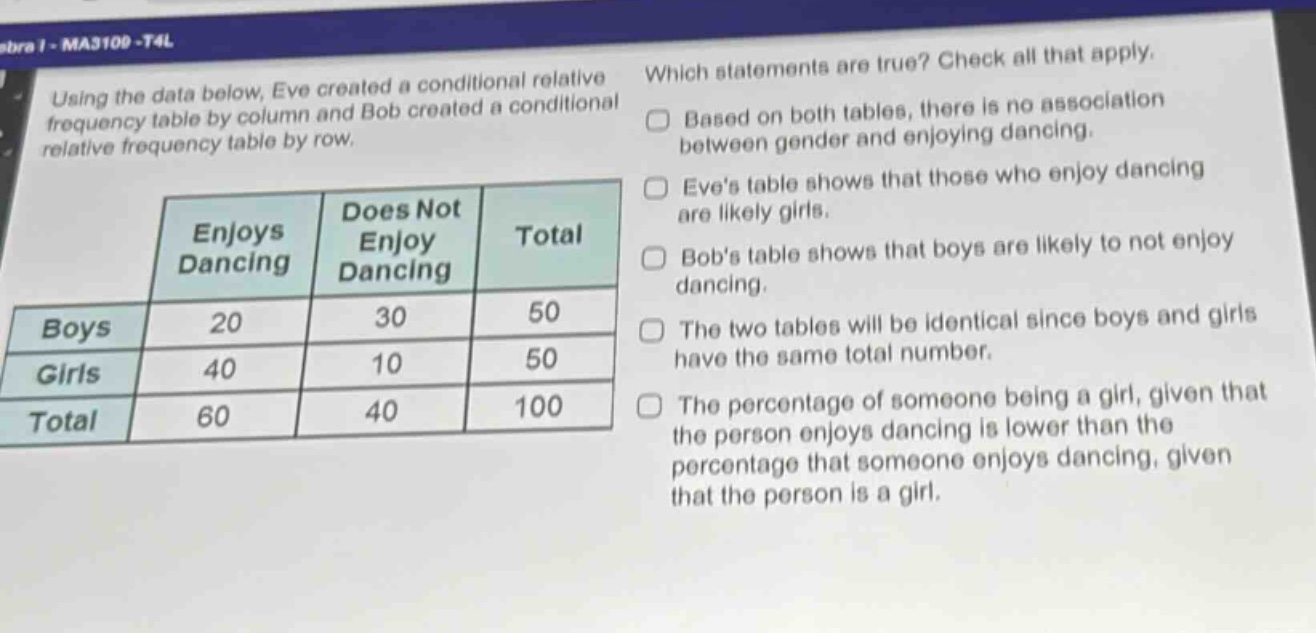
using the data below, eve created a conditional relative frequency table by column and bob created a conditional relative frequency table by row.\n| | enjoys dancing | does not enjoy dancing | total |\n|--|--|--|--|\n| boys | 20 | 30 | 50 |\n| girls | 40 | 10 | 50 |\n| total | 60 | 40 | 100 |\nwhich statements are true? check all that apply.\nbased on both tables, there is no association between gender and enjoying dancing.\neves table shows that those who enjoy dancing are likely girls.\nbobs table shows that boys are likely to not enjoy dancing.\nthe two tables will be identical since boys and girls have the same total number.\nthe percentage of someone being a girl, given that the person enjoys dancing is lower than the percentage that someone enjoys dancing, given that the person is a girl.
Answer
Explanation:
Step1: Analyze association between gender and dancing
If there was no association, the ratios of boys/girls who enjoy or don't enjoy dancing would be similar. But from the table, $\frac{20}{50}=0.4$ of boys enjoy dancing and $\frac{40}{50} = 0.8$ of girls enjoy dancing, so there is an association. So the first - statement is false.
Step2: Analyze Eve's table
In Eve's column - based conditional relative frequency table, if we consider the "Enjoys Dancing" column, the proportion of girls is $\frac{40}{60}\approx0.67$ and of boys is $\frac{20}{60}\approx0.33$. So those who enjoy dancing are likely girls. This statement is true.
Step3: Analyze Bob's table
In Bob's row - based conditional relative frequency table, for boys, the proportion of those who do not enjoy dancing is $\frac{30}{50}=0.6$. So Bob's table shows that boys are likely to not enjoy dancing. This statement is true.
Step4: Analyze table identity
A column - based and a row - based conditional relative frequency table are calculated differently. Column - based is $\frac{\text{cell value}}{\text{column total}}$ and row - based is $\frac{\text{cell value}}{\text{row total}}$. So they won't be identical even if row totals are the same. This statement is false.
Step5: Calculate conditional probabilities
The percentage of someone being a girl, given that the person enjoys dancing is $P(\text{girl}|\text{enjoys dancing})=\frac{40}{60}\approx0.67$. The percentage that someone enjoys dancing, given that the person is a girl is $P(\text{enjoys dancing}|\text{girl})=\frac{40}{50} = 0.8$. So the fifth statement is false.
Answer:
Eve's table shows that those who enjoy dancing are likely girls. Bob's table shows that boys are likely to not enjoy dancing.