using the data below, eve created a conditional relative frequency table by column and bob created a…
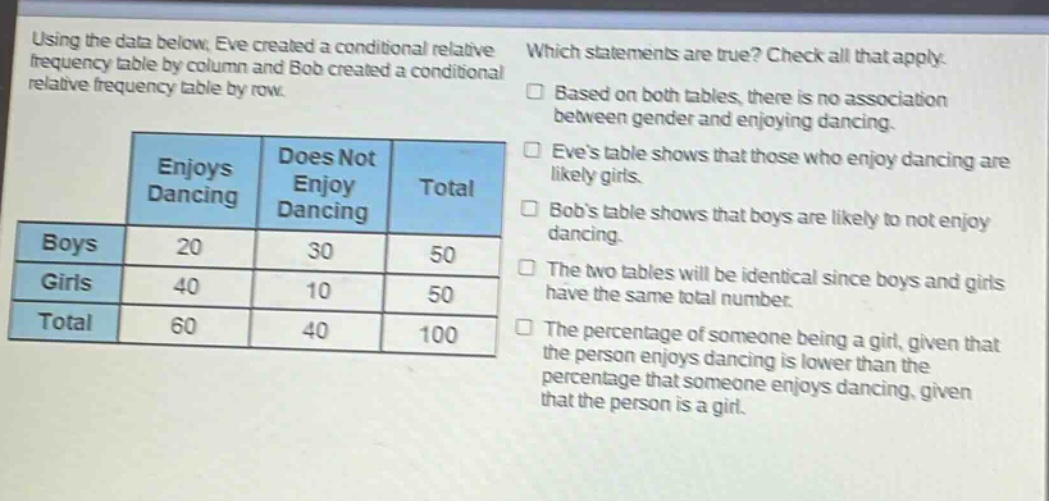
using the data below, eve created a conditional relative frequency table by column and bob created a conditional relative frequency table by row.\n| | enjoys dancing | does not enjoy dancing | total |\n|--|--|--|--|\n| boys | 20 | 30 | 50 |\n| girls | 40 | 10 | 50 |\n| total | 60 | 40 | 100 |\nwhich statements are true? check all that apply.\n□ based on both tables, there is no association between gender and enjoying dancing.\n□ eves table shows that those who enjoy dancing are likely girls.\n□ bobs table shows that boys are likely to not enjoy dancing.\n□ the two tables will be identical since boys and girls have the same total number.\n□ the percentage of someone being a girl, given that the person enjoys dancing is lower than the percentage that someone enjoys dancing, given that the person is a girl.
Answer
Answer:
- B. Eve's table shows that those who enjoy dancing are likely girls.
- C. Bob's table shows that boys are likely to not enjoy dancing.
Explanation:
Step1: Analyze Eve's table (column - conditional)
In Eve's column - conditional table, among those who enjoy dancing (60 in total), 40 are girls ($\frac{40}{60}=\frac{2}{3}$). So those who enjoy dancing are likely girls.
Step2: Analyze Bob's table (row - conditional)
In Bob's row - conditional table, among boys (50 in total), 30 do not enjoy dancing ($\frac{30}{50} = 0.6$). So boys are likely to not enjoy dancing.
Step3: Analyze association claim
There is an association as the ratios of boys/girls who enjoy or don't enjoy dancing are different, so the claim of no association is false.
Step4: Analyze table identity claim
A column - conditional and a row - conditional table are calculated differently and will not be identical.
Step5: Analyze probability comparison claim
The probability that someone is a girl given they enjoy dancing is $\frac{40}{60}=\frac{2}{3}$. The probability that someone enjoys dancing given they are a girl is $\frac{40}{50}=\frac{4}{5}$. $\frac{2}{3}<\frac{4}{5}$ is false.