using the data provided in the dot plot above, find the mean fuel economy. round your answer to the nearest…
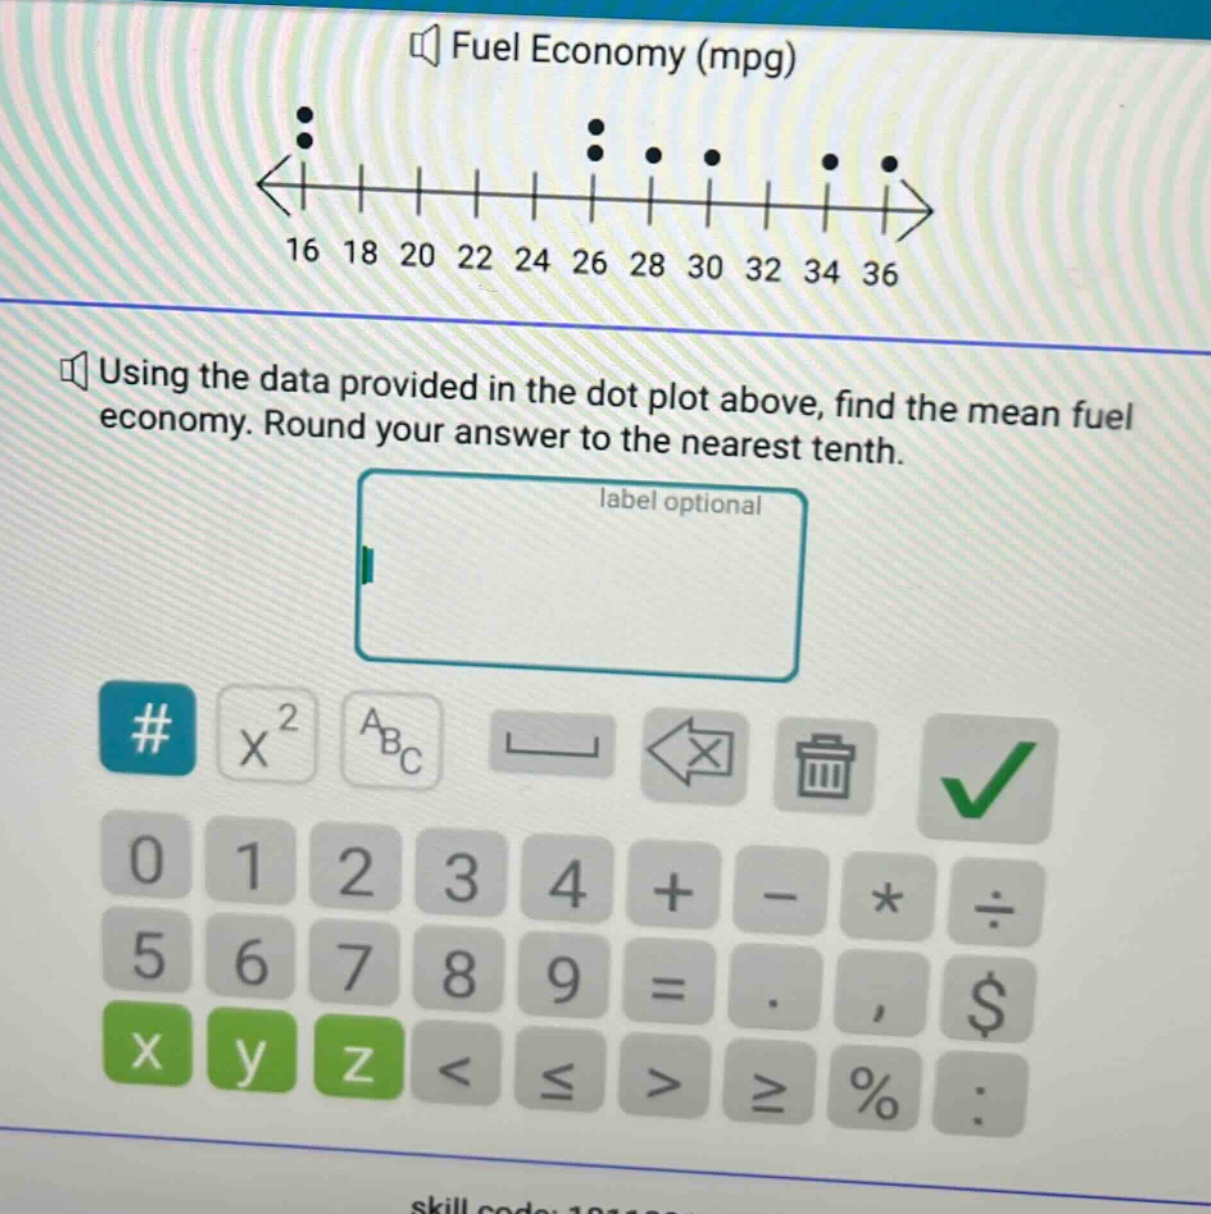
using the data provided in the dot plot above, find the mean fuel economy. round your answer to the nearest tenth.
Answer
Explanation:
Step1: Count data - points
There are 2 points at 16, 0 at 18, 0 at 20, 0 at 22, 0 at 24, 2 at 26, 2 at 28, 1 at 30, 1 at 32, 1 at 34.
Step2: Calculate sum of data - points
[S=(16\times2)+(26\times2)+(28\times2)+30 + 32+34=32 + 52+56+30+32+34 = 236]
Step3: Calculate number of data - points
[n=2 + 2+2+1+1+1=9]
Step4: Calculate the mean
[\bar{x}=\frac{S}{n}=\frac{236}{9}\approx26.2]
Answer:
26.2