using the data from the table, what is p(3)? what is the mean of the probability distribution?\n| x |…
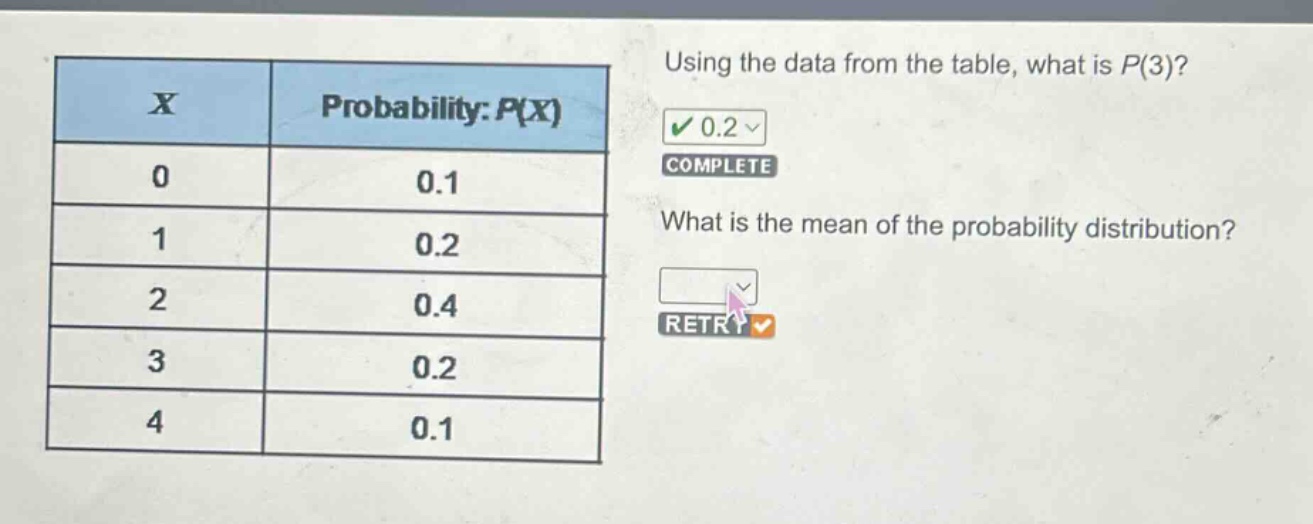
using the data from the table, what is p(3)? what is the mean of the probability distribution?\n| x | probability: p(x) |\n|----|----| \n| 0 | 0.1 |\n| 1 | 0.2 |\n| 2 | 0.4 |\n| 3 | 0.2 |\n| 4 | 0.1 |
Answer
Explanation:
Step1: Recall mean formula
The mean $\mu$ of a probability - distribution is given by $\mu=\sum_{x}x\cdot P(x)$.
Step2: Calculate each product
For $x = 0$: $0\times0.1 = 0$; for $x = 1$: $1\times0.2=0.2$; for $x = 2$: $2\times0.4 = 0.8$; for $x = 3$: $3\times0.2=0.6$; for $x = 4$: $4\times0.1 = 0.4$.
Step3: Sum up the products
$\mu=0 + 0.2+0.8 + 0.6+0.4$. $\mu=2$.
Answer:
$2$