using the graph as a reference, select all statements that are true about a normal distribution of data…
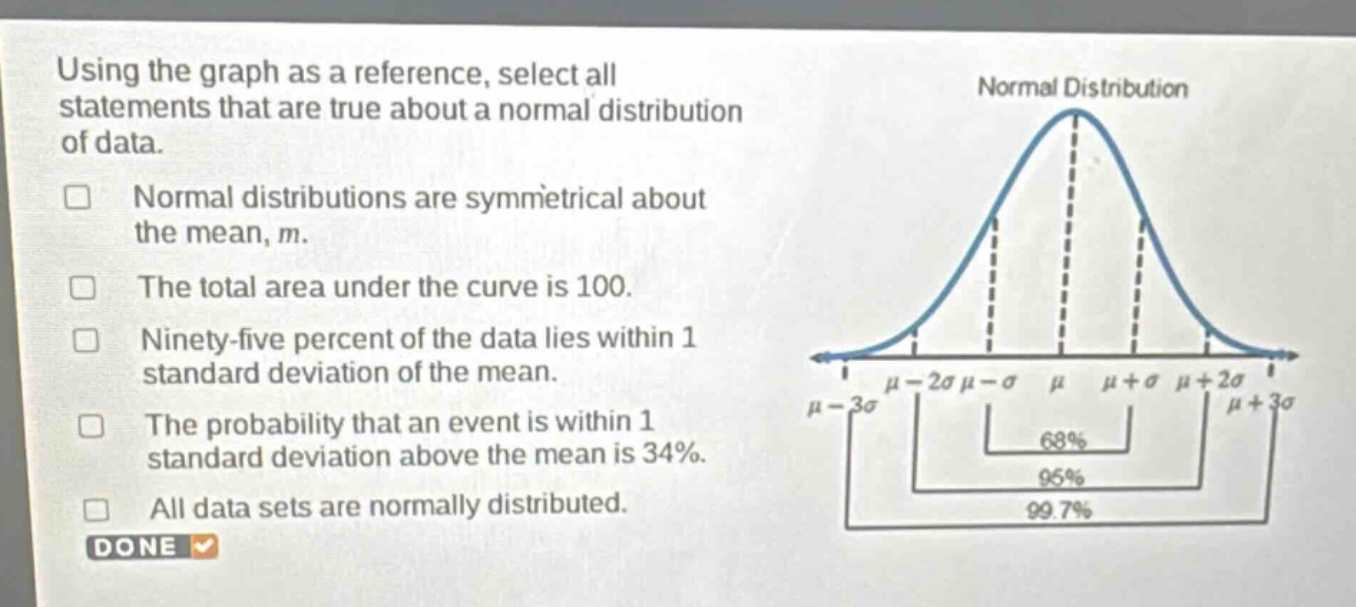
using the graph as a reference, select all statements that are true about a normal distribution of data. normal distributions are symmetrical about the mean, m. the total area under the curve is 100. ninety - five percent of the data lies within 1 standard deviation of the mean. the probability that an event is within 1 standard deviation above the mean is 34%. all data sets are normally distributed.
Answer
Answer:
- Normal distributions are symmetrical about the mean, $m$.
- The probability that an event is within 1 standard deviation above the mean is 34%.
Explanation:
Step1: Recall normal - distribution properties
Normal distribution is symmetric about its mean $\mu$ (here denoted as $m$). So the first statement is true.
Step2: Analyze area under the curve
The total area under the normal - distribution curve is 1 (or 100% when expressed as a percentage), not 100. So the second statement is false.
Step3: Recall the empirical rule
About 68% of the data lies within 1 standard deviation of the mean, not 95%. So the third statement is false.
Step4: Use the empirical rule for 1 - standard - deviation
Since about 68% of the data lies within $\mu\pm\sigma$, the probability that an event is within 1 standard deviation above the mean is $\frac{68%}{2}=34%$. So the fourth statement is true.
Step5: Consider data - set distribution
Not all data sets are normally distributed. There are many other types of distributions like skewed distributions. So the fifth statement is false.