using the graph as a reference, select all statements that are true about a normal distribution of data…
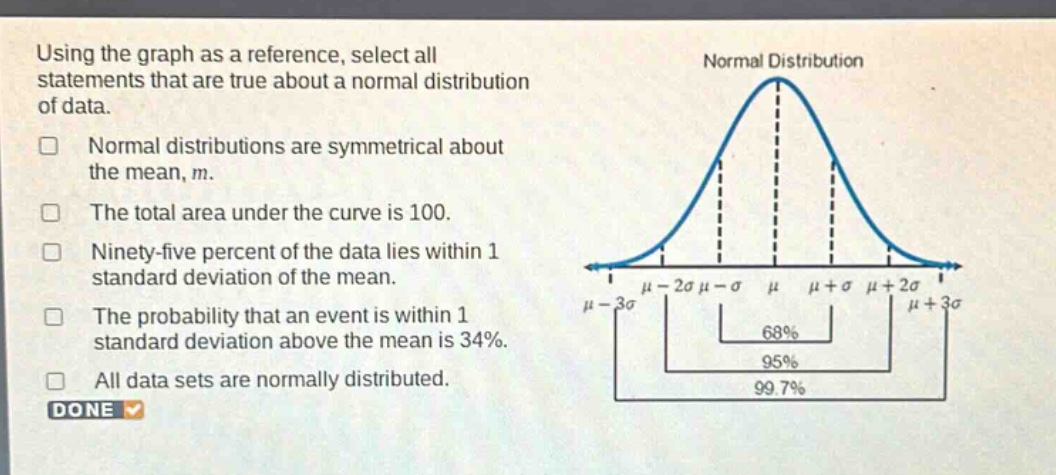
using the graph as a reference, select all statements that are true about a normal distribution of data. normal distributions are symmetrical about the mean, m. the total area under the curve is 100. ninety - five percent of the data lies within 1 standard deviation of the mean. the probability that an event is within 1 standard deviation above the mean is 34%. all data sets are normally distributed. done
Answer
Brief Explanations:
- Normal distributions are symmetric about the mean $\mu$.
- The total area under the normal - curve is 1 (or 100% when expressed as a percentage).
- Approximately 68% of the data lies within 1 standard deviation of the mean, 95% within 2 standard deviations, and 99.7% within 3 standard deviations. The probability that an event is within 1 standard deviation above the mean is half of 68%, which is 34%. Not all data sets are normally distributed.
Answer:
- Normal distributions are symmetrical about the mean, $m$. (True)
- The total area under the curve is 100. (False, it's 1 or 100% but not the number 100 without the % sign)
- Ninety - five percent of the data lies within 1 standard deviation of the mean. (False, it's 68% within 1 standard deviation)
- The probability that an event is within 1 standard deviation above the mean is 34%. (True)
- All data sets are normally distributed. (False)