using the histograms, which of the following is the correct comparison of the distributions?\nthe 10 - 20…
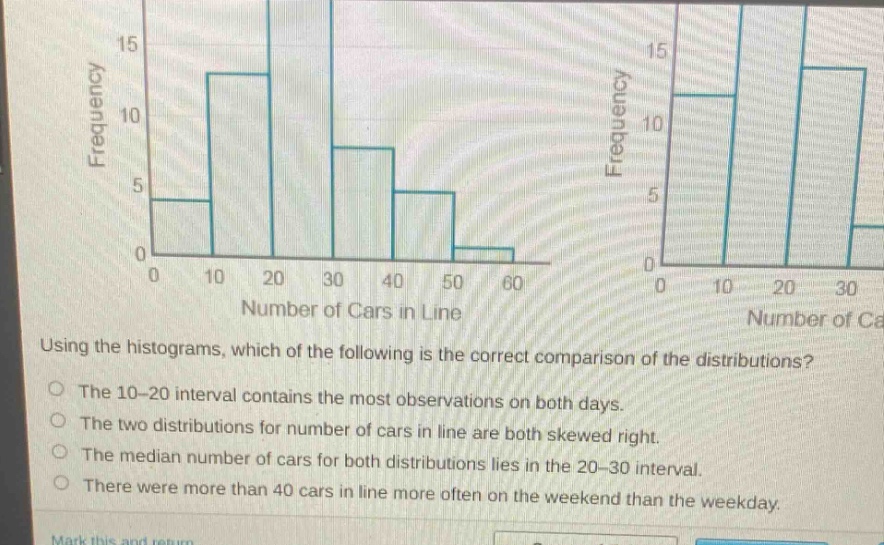
using the histograms, which of the following is the correct comparison of the distributions?\nthe 10 - 20 interval contains the most observations on both days.\nthe two distributions for number of cars in line are both skewed right.\nthe median number of cars for both distributions lies in the 20 - 30 interval.\nthere were more than 40 cars in line more often on the weekend than the weekday.
Answer
Explanation:
Step1: Analyze the 10 - 20 interval
In the first histogram, the frequency in the 10 - 20 interval is high. In the second histogram, the highest - frequency interval is 20 - 30, not 10 - 20. So the statement "The 10 - 20 interval contains the most observations on both days" is false.
Step2: Check the skewness
For the first histogram, the tail on the right side (higher values) is longer, so it is skewed right. For the second histogram, the tail on the right side (higher values) is also longer, so both distributions are skewed right.
Step3: Estimate the median
For a histogram, to find the median class, we consider the cumulative frequency. Since the total frequency is not given precisely, but by looking at the shape and relative frequencies, we cannot be sure that the median lies in the 20 - 30 interval for both.
Step4: Compare the number of cars > 40
In the first histogram, the frequency of cars more than 40 is relatively low. In the second histogram, the frequency of cars more than 40 is also low, and there is no clear indication that there were more than 40 cars in line more often on the weekend than the weekday.
Answer:
The two distributions for number of cars in line are both skewed right.