using the regression calculator\njohn sells frozen fruit bars at a stand in a park during the summer months…
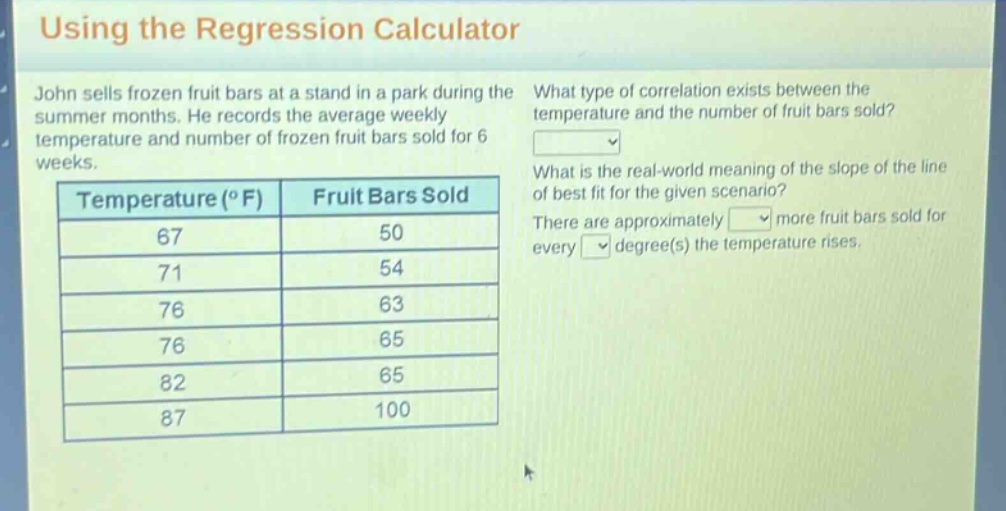
using the regression calculator\njohn sells frozen fruit bars at a stand in a park during the summer months. he records the average weekly temperature and number of frozen fruit bars sold for 6 weeks.\ntemperature (°f) fruit bars sold\n67 50\n71 54\n76 63\n76 65\n82 65\n87 100\nwhat type of correlation exists between the temperature and the number of fruit bars sold?\nwhat is the real - world meaning of the slope of the line of best fit for the given scenario?\nthere are approximately more fruit bars sold for every degree(s) the temperature rises.
Answer
Explanation:
Step1: Analyze data trend
As temperature increases from 67°F to 87°F, the number of fruit - bars sold generally increases from 50 to 100. So, there is a positive correlation.
Step2: Calculate slope conceptually
The slope of the line of best - fit represents the change in the number of fruit bars sold for a unit change in temperature. In this case, as temperature rises, the number of fruit bars sold increases. We can estimate the slope by looking at the general trend. For example, when the temperature changes from 67°F to 87°F (a change of 20°F), the number of fruit bars sold changes from 50 to 100 (a change of 50). The average change in the number of fruit bars sold per degree increase in temperature is $\frac{100 - 50}{87 - 67}=\frac{50}{20}=2.5$. So, there are approximately 2.5 more fruit bars sold for every 1 degree the temperature rises.
Answer:
Positive correlation; 2.5; 1