which value is the best estimate for the correlation coefficient of the data set?\na. 1\nb. 0\nc. -0.2\nd…
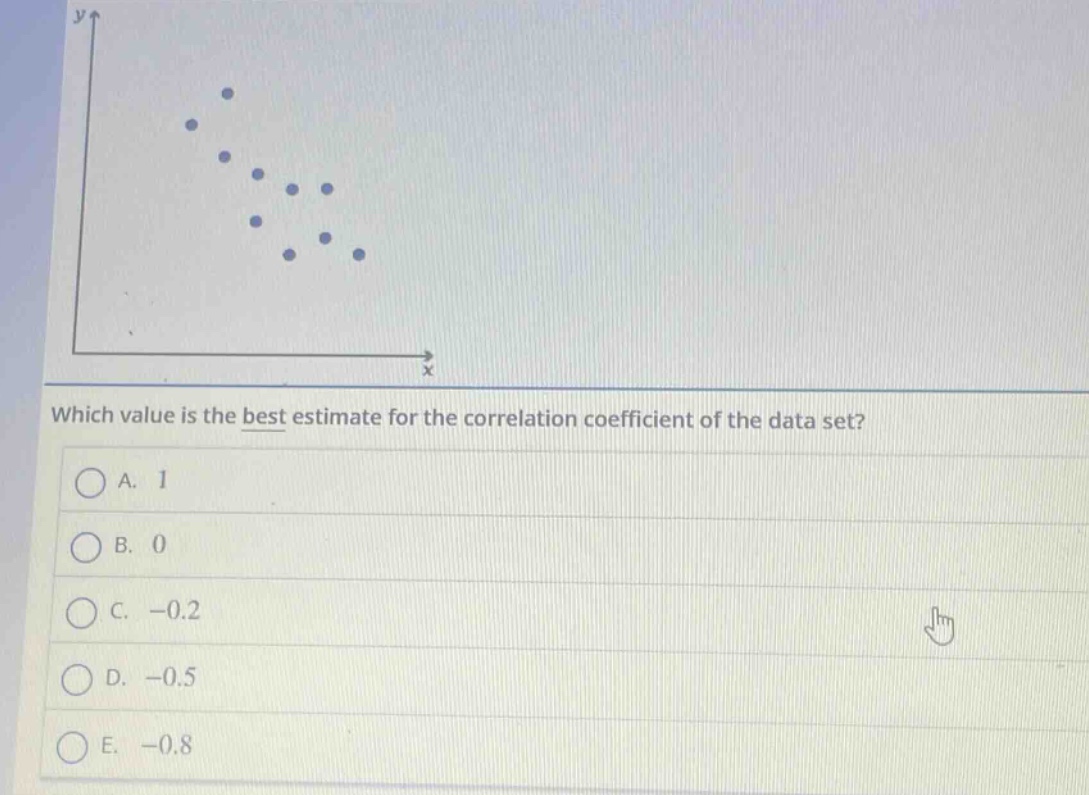
which value is the best estimate for the correlation coefficient of the data set?\na. 1\nb. 0\nc. -0.2\nd. -0.5\ne. -0.8
Answer
Explanation:
Step1: Analyze the scatter - plot trend
The points in the scatter - plot show a negative linear trend. As the value of (x) increases, the value of (y) generally decreases.
Step2: Recall correlation coefficient range
The correlation coefficient (r) ranges from (- 1) to (1). A value of (r = 1) indicates a perfect positive linear relationship, (r = 0) indicates no linear relationship, and (r=-1) indicates a perfect negative linear relationship.
Step3: Evaluate the strength of the negative relationship
The points do not form a perfect straight - line, so (r\neq - 1). But the negative trend is relatively strong. A value of (r=-0.2) is a weak negative correlation, and (r = - 0.5) is a moderate negative correlation. The trend in the scatter - plot is stronger than a moderate negative correlation, so (r\approx - 0.8) is a better estimate.
Answer:
E. (-0.8)