what is the value of the interquartile range of the data below? 0 10 20 30 40 50 6 12 14 24
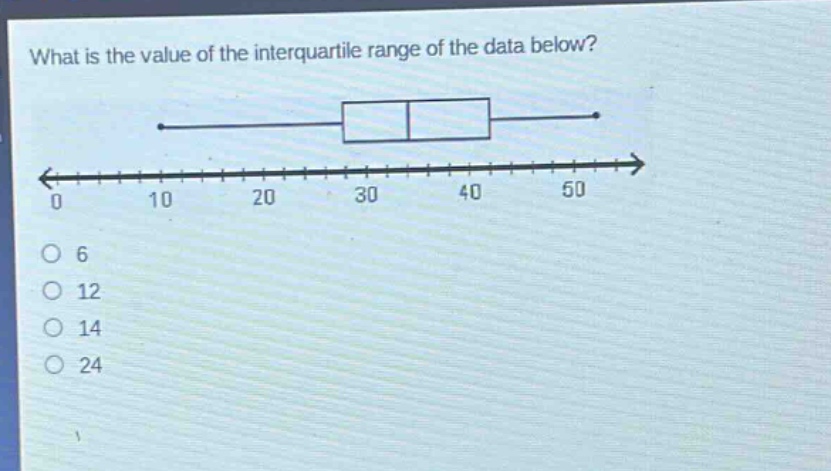
what is the value of the interquartile range of the data below? 0 10 20 30 40 50 6 12 14 24
Answer
Explanation:
Step1: Identify Q1 and Q3
In a box - and - whisker plot, the left - hand side of the box is Q1 and the right - hand side of the box is Q3. From the plot, Q1 = 26 and Q3 = 40.
Step2: Calculate the inter - quartile range (IQR)
The formula for the inter - quartile range is IQR=Q3 - Q1. Substitute Q1 = 26 and Q3 = 40 into the formula: IQR = 40−26. IQR = 14
Answer:
14