which value for y in the table would be least likely to indicate an association between the variables? 0.06…
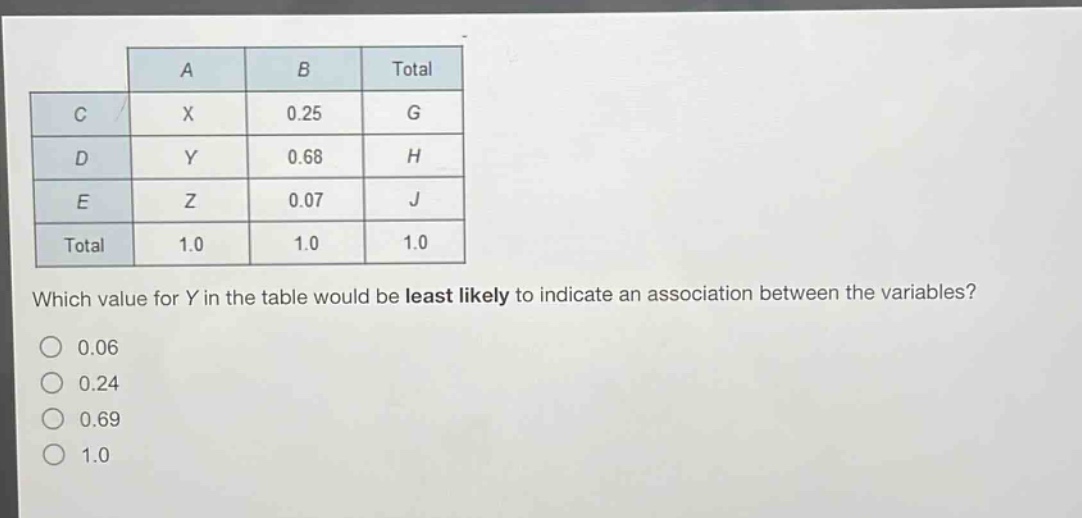
which value for y in the table would be least likely to indicate an association between the variables? 0.06 0.24 0.69 1.0
Answer
Answer:
B. 0.24
Explanation:
Step1: Understand independence concept
If two - way table variables are independent, the row - column products should be consistent. When there is no association (i.e., variables are independent), the proportion of values in each cell should follow the overall row and column proportions.
Step2: Analyze column B proportions
In column B, the total proportion is 1.0. The values in column B for rows C, D, and E are 0.25, 0.68, and 0.07 respectively. For no association, the proportion of values in column A for each row should be in the same relative proportion as the values in column B for those rows. The sum of the values in column B for rows C, D, and E is (0.25 + 0.68+0.07=1.0). If there is no association, the proportion of values in column A for row D should be such that the relationship between the rows in both columns is consistent. If we consider the fact that for independence, the values in each row should be in proportion to the overall column totals. The value of Y that would make the distribution in column A similar to that in column B in terms of row - to - row proportion is one that keeps the balance. If (Y = 0.24), the distribution of values in column A would be more in line with what we would expect if the variables were independent compared to the other values. When (Y = 0.06), it is too small compared to the other values in column B for the corresponding rows. When (Y = 0.69) or (Y = 1.0), it disrupts the balance that would be expected if there was no association between the variables.