which value for r in the table would most likely indicate an association between the conditional…
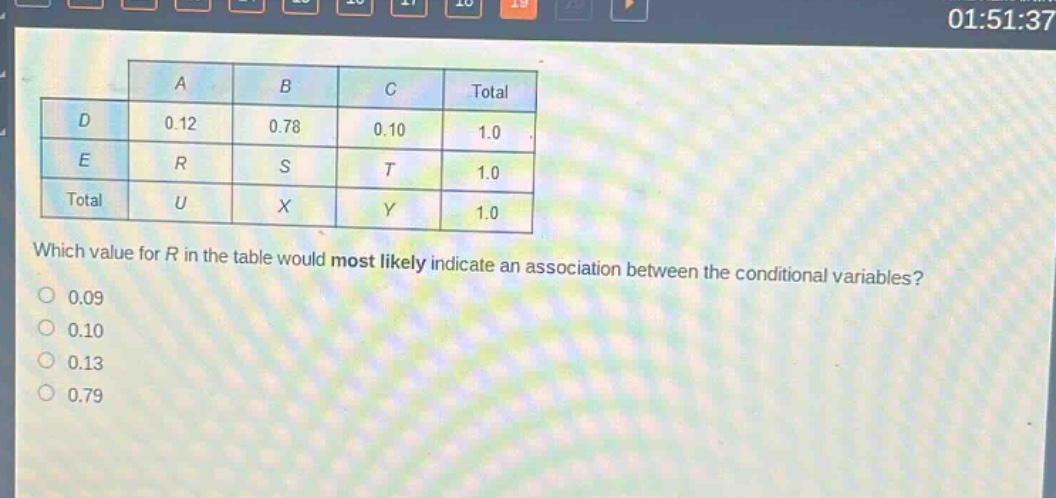
which value for r in the table would most likely indicate an association between the conditional variables?\n0.09\n0.10\n0.13\n0.79\n\n| | a | b | c | total |\n|--|--|--|--|--|\n| d | 0.12 | 0.78 | 0.10 | 1.0 |\n| e | r | s | t | 1.0 |\n| total | u | x | y | 1.0 |
Answer
Explanation:
Step1: Recall association concept
In a two - way frequency table, if there is no association between the variables, the row and column proportions are similar. For the first row, the proportion of the first category is 0.12. If there is an association, the proportion in the corresponding cell of the second row (R) should be very different from 0.12.
Step2: Analyze options
- Option 0.09 is close to 0.12.
- Option 0.10 is close to 0.12.
- Option 0.13 is relatively close to 0.12.
- Option 0.79 is very different from 0.12.
Answer:
0.79