these are the values in ariels data set. (1, 67), (3, 88), (5, 97), (6, 101), (8, 115) ariel determines the…
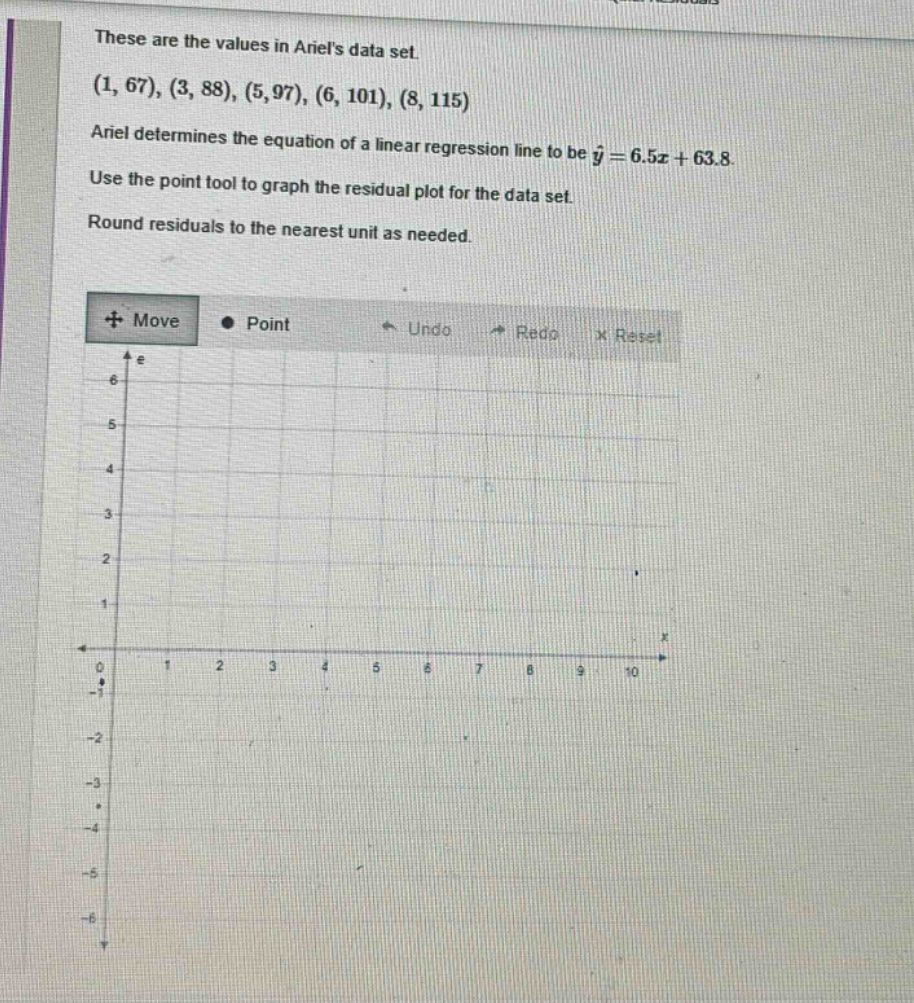
these are the values in ariels data set. (1, 67), (3, 88), (5, 97), (6, 101), (8, 115) ariel determines the equation of a linear regression line to be $hat{y}=6.5x + 63.8$. use the point tool to graph the residual plot for the data set. round residuals to the nearest unit as needed.
Answer
Explanation:
Step1: Recall residual formula
Residual $e = y-\hat{y}$, where $y$ is the actual - value and $\hat{y}$ is the predicted value.
Step2: Calculate predicted values for each $x$ - value
For $(x = 1)$: $\hat{y}=6.5\times1 + 63.8=6.5+63.8 = 70.3$. Residual $e_1=67 - 70.3=- 3.3\approx - 3$. For $(x = 3)$: $\hat{y}=6.5\times3+63.8 = 19.5+63.8=83.3$. Residual $e_2=88 - 83.3 = 4.7\approx5$. For $(x = 5)$: $\hat{y}=6.5\times5+63.8=32.5 + 63.8 = 96.3$. Residual $e_3=97 - 96.3 = 0.7\approx1$. For $(x = 6)$: $\hat{y}=6.5\times6+63.8=39+63.8 = 102.8$. Residual $e_4=101 - 102.8=-1.8\approx - 2$. For $(x = 8)$: $\hat{y}=6.5\times8+63.8=52+63.8 = 115.8$. Residual $e_5=115 - 115.8=-0.8\approx - 1$.
Step3: Plot the points
The points to plot on the residual - plot are $(1,-3),(3,5),(5,1),(6, - 2),(8,-1)$.
Answer:
The points to be plotted on the residual plot are $(1,-3),(3,5),(5,1),(6, - 2),(8,-1)$.