these are the values in irwins data set. (1, 43), (3, 36), (5, 22), (6, 25), (8, 14) irwin determined the…
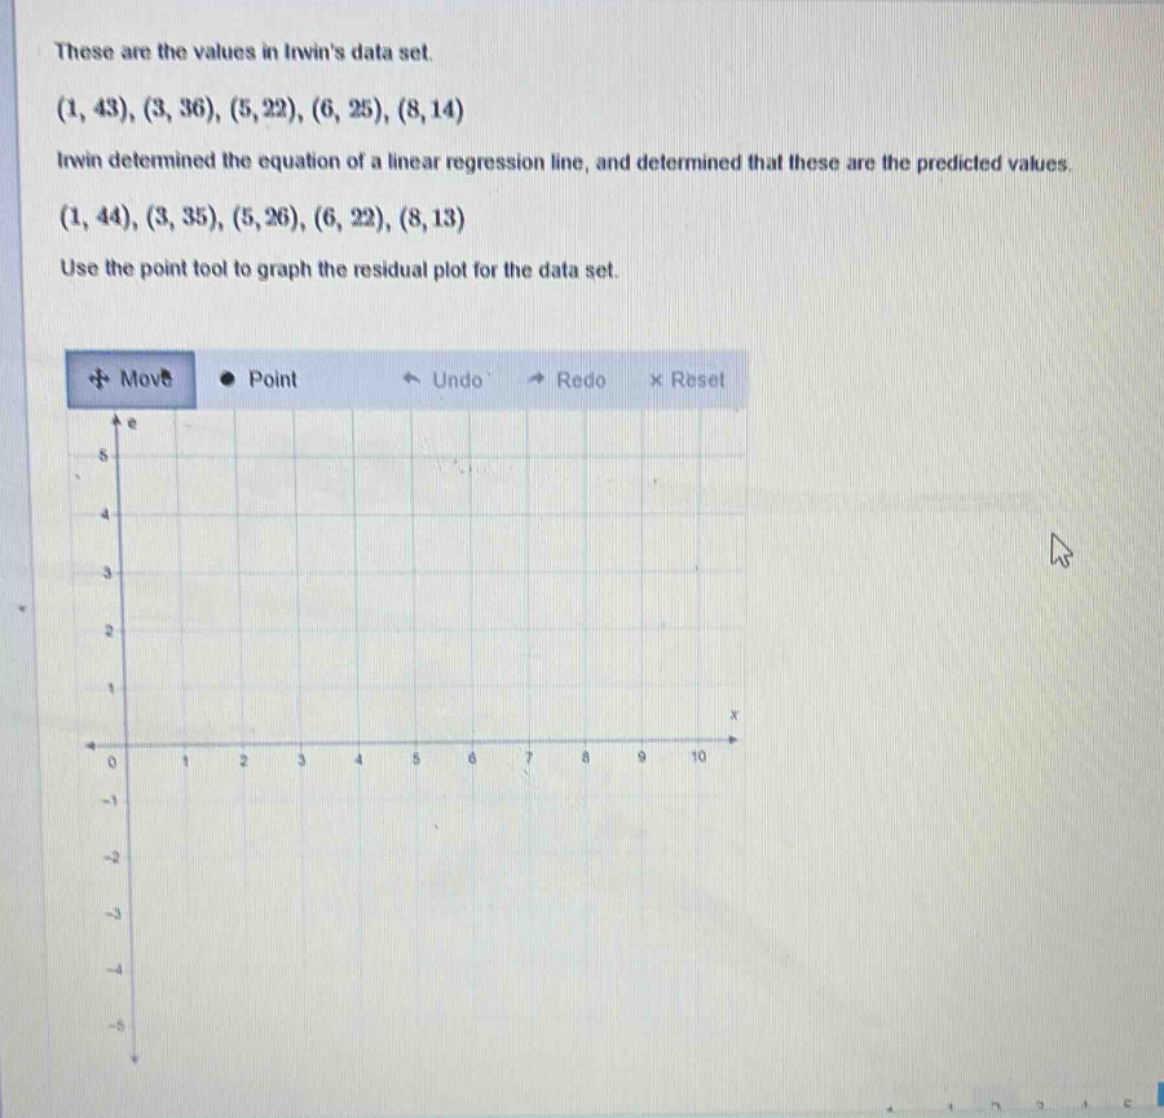
these are the values in irwins data set. (1, 43), (3, 36), (5, 22), (6, 25), (8, 14) irwin determined the equation of a linear regression line, and determined that these are the predicted values. (1, 44), (3, 35), (5, 26), (6, 22), (8, 13) use the point tool to graph the residual plot for the data set.
Answer
Explanation:
Step1: Recall residual formula
Residual = Observed - Predicted.
Step2: Calculate residuals for each data - point
For (1, 43) and (1, 44): Residual = 43 - 44=-1. For (3, 36) and (3, 35): Residual = 36 - 35 = 1. For (5, 22) and (5, 26): Residual = 22 - 26=-4. For (6, 25) and (6, 22): Residual = 25 - 22 = 3. For (8, 14) and (8, 13): Residual = 14 - 13 = 1.
Step3: Plot the points
Plot the points (1, - 1), (3, 1), (5, - 4), (6, 3), (8, 1) on the given grid.
Answer:
Plot the points (1, - 1), (3, 1), (5, - 4), (6, 3), (8, 1) on the residual - plot grid.