a variety of two types of snack packs are delivered to a store. the box plots compare the number of calories…
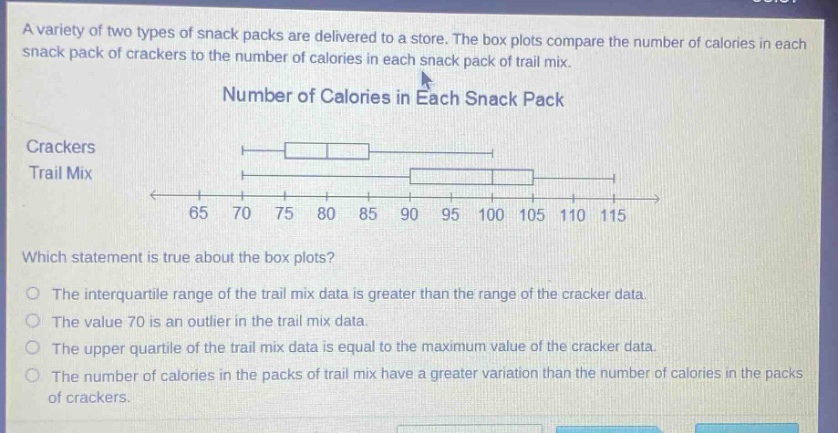
a variety of two types of snack packs are delivered to a store. the box plots compare the number of calories in each snack pack of crackers to the number of calories in each snack pack of trail mix. number of calories in each snack pack crackers trail mix which statement is true about the box plots? the interquartile range of the trail mix data is greater than the range of the cracker data. the value 70 is an outlier in the trail mix data. the upper quartile of the trail mix data is equal to the maximum value of the cracker data. the number of calories in the packs of trail mix have a greater variation than the number of calories in the packs of crackers.
Answer
Answer:
The number of calories in the packs of trail mix have a greater variation than the number of calories in the packs of crackers.
Explanation:
Step1: Recall box - plot concepts
Box - plot shows quartiles and range.
Step2: Analyze cracker data
For crackers, range is from about 70 to 100, IQR is smaller.
Step3: Analyze trail - mix data
For trail mix, range is from about 90 to 115, IQR is larger.
Step4: Evaluate statements
The trail - mix data has a larger range and IQR, indicating greater variation.