a variety of two types of snack packs are delivered to a store. the box plots compare the number of calories…
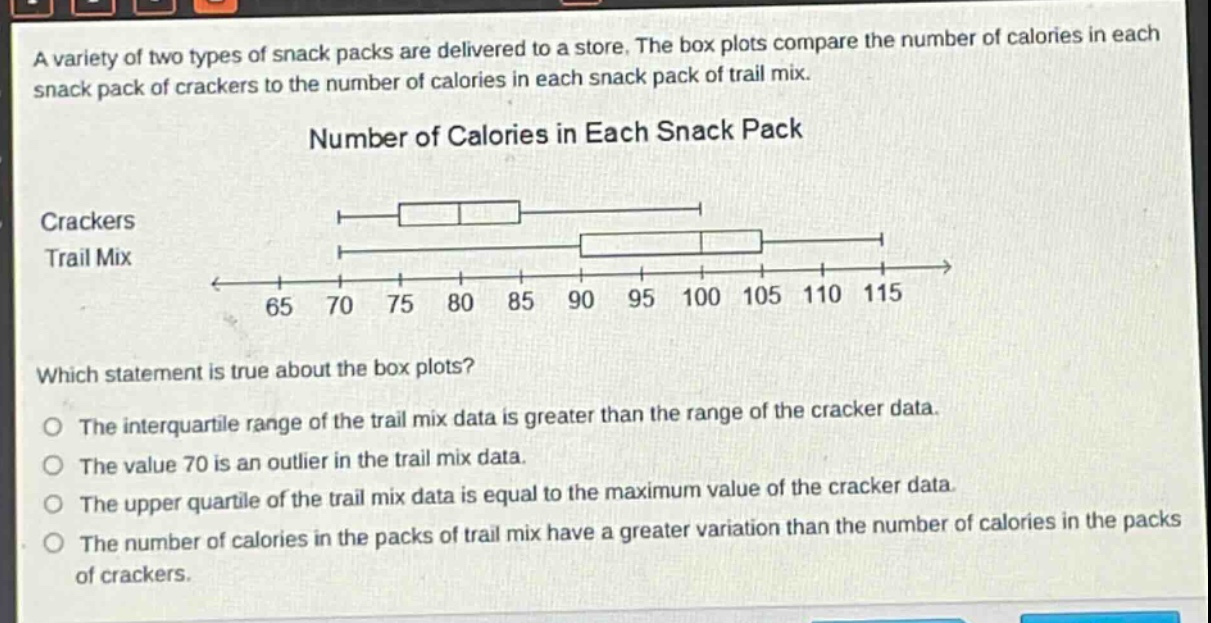
a variety of two types of snack packs are delivered to a store. the box plots compare the number of calories in each snack pack of crackers to the number of calories in each snack pack of trail mix.\nnumber of calories in each snack pack\ncrackers\ntrail mix\n65 70 75 80 85 90 95 100 105 110 115\nwhich statement is true about the box plots?\nthe interquartile range of the trail mix data is greater than the range of the cracker data.\nthe value 70 is an outlier in the trail mix data.\nthe upper quartile of the trail mix data is equal to the maximum value of the cracker data.\nthe number of calories in the packs of trail mix have a greater variation than the number of calories in the packs of crackers.
Answer
Answer:
The number of calories in the packs of trail mix have a greater variation than the number of calories in the packs of crackers.
Explanation:
Step1: Analyze range and IQR
For crackers, range and IQR are relatively small. For trail - mix, they are larger.
Step2: Check outlier
70 is not an outlier in trail - mix data as it is within the whisker range.
Step3: Compare quartile and max
Upper quartile of trail - mix is not equal to max of cracker data.
Step4: Compare variations
Trail - mix box plot has a wider spread (from minimum to maximum and interquartile range), indicating greater variation in calorie numbers compared to crackers.