a variety of two types of snack packs are delivered to a store. the box plots compare the number of calories…
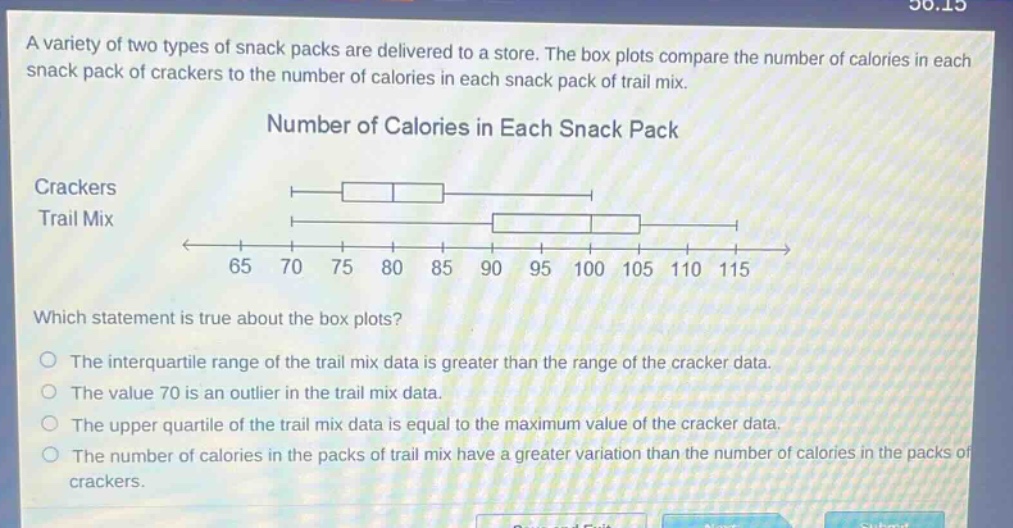
a variety of two types of snack packs are delivered to a store. the box plots compare the number of calories in each snack pack of crackers to the number of calories in each snack pack of trail mix. number of calories in each snack pack crackers trail mix 65 70 75 80 85 90 95 100 105 110 115 which statement is true about the box plots? the interquartile range of the trail mix data is greater than the range of the cracker data. the value 70 is an outlier in the trail mix data. the upper quartile of the trail mix data is equal to the maximum value of the cracker data. the number of calories in the packs of trail mix have a greater variation than the number of calories in the packs of crackers.
Answer
Explanation:
Step1: Recall box - plot concepts
The range is the difference between the maximum and minimum values. The inter - quartile range (IQR) is the difference between the upper quartile (Q3) and the lower quartile (Q1). For crackers:
- Minimum value ($min_{c}$) is around 70, maximum value ($max_{c}$) is around 85. So the range of cracker data, $R_{c}=max_{c}-min_{c}=85 - 70=15$.
- Q1 is around 75, Q3 is around 80. So the IQR of cracker data, $IQR_{c}=Q3 - Q1=80 - 75 = 5$. For trail mix:
- Minimum value ($min_{t}$) is around 90, maximum value ($max_{t}$) is around 115.
- Q1 is around 95, Q3 is around 105. So the IQR of trail - mix data, $IQR_{t}=Q3 - Q1=105 - 95 = 10$.
Step2: Analyze each option
Option 1
The IQR of trail - mix data ($IQR_{t}=10$) and the range of cracker data ($R_{c}=15$). Since $10<15$, this option is false.
Option 2
To check for outliers, we use the 1.5 * IQR rule. For trail - mix, $IQR_{t}=10$. Lower fence $=Q1-1.5\times IQR=95 - 1.5\times10=95 - 15 = 80$. Since 70 is not part of the trail - mix data set (trail - mix min is around 90), 70 is not an outlier of the trail - mix data. This option is false.
Option 3
The upper quartile of trail - mix data ($Q3_{t}=105$) and the maximum value of cracker data ($max_{c}=85$). Since $105\neq85$, this option is false.
Option 4
The range of trail - mix data, $R_{t}=max_{t}-min_{t}=115 - 90 = 25$. The range of cracker data, $R_{c}=85 - 70 = 15$. Since $25>15$, the number of calories in the packs of trail - mix has a greater variation than the number of calories in the packs of crackers. This option is true.
Answer:
The number of calories in the packs of trail mix have a greater variation than the number of calories in the packs of crackers.