2. in the venn diagram below, circles $s$, $c$, and $p$ represent farms raising sheep, cows, and pigs…
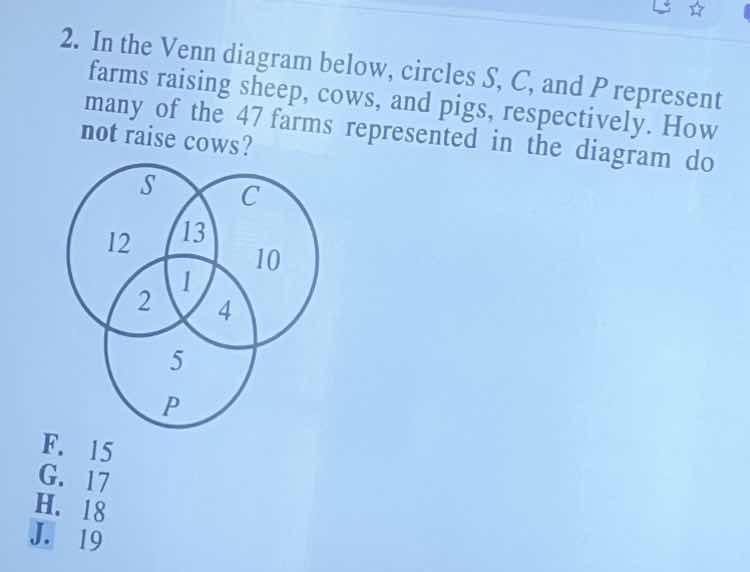
2. in the venn diagram below, circles $s$, $c$, and $p$ represent farms raising sheep, cows, and pigs, respectively. how many of the 47 farms represented in the diagram do not raise cows?\nf. 15\ng. 17\nh. 18\nj. 19
Answer
Explanation:
Step1: Identify regions outside circle C
Identify the numbers in the Venn diagram that are not contained within circle $C$.
Step2: Sum the identified values
Add the values representing farms that raise only sheep, only pigs, or both sheep and pigs (but no cows). $$12 + 2 + 5$$
Step3: Calculate the final total
Perform the addition to find the total number of farms that do not raise cows. $$12 + 2 + 5 = 19$$
Answer:
J. 19