the venn diagram represents the results of a survey that asked participants whether they would want a rabbit…
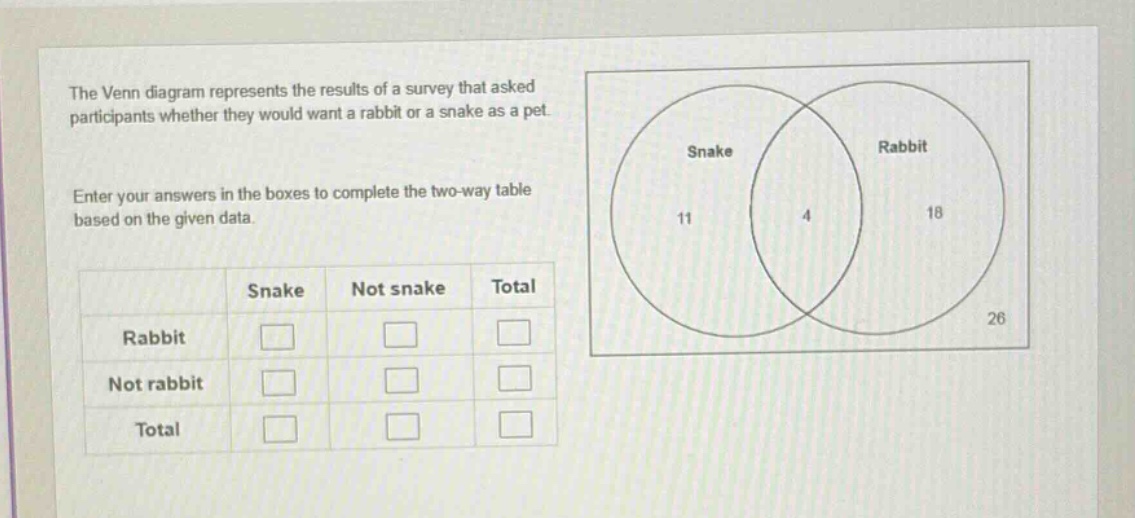
the venn diagram represents the results of a survey that asked participants whether they would want a rabbit or a snake as a pet. enter your answers in the boxes to complete the two - way table based on the given data.\n| | snake | not snake | total |\n|--|--|--|--|\n| rabbit | | | |\n| not rabbit | | | |\n| total | | | |
Answer
Explanation:
Step1: Identify values from the Venn diagram
Extract the number of participants for each category from the Venn diagram.
- Want Snake only (Snake, Not rabbit): 11
- Want Rabbit only (Rabbit, Not snake): 18
- Want both Snake and Rabbit (Snake, Rabbit): 4
- Want neither (Not snake, Not rabbit): 26
Step2: Fill the inner cells of the table
Place the identified values into the corresponding cells of the two-way table.
- Cell (Rabbit, Snake): 4
- Cell (Rabbit, Not snake): 18
- Cell (Not rabbit, Snake): 11
- Cell (Not rabbit, Not snake): 26
Step3: Calculate row totals
Sum the values across each row to find the totals.
- Total Rabbit = (Rabbit, Snake) + (Rabbit, Not snake) = $4 + 18 = 22$
- Total Not rabbit = (Not rabbit, Snake) + (Not rabbit, Not snake) = $11 + 26 = 37$
Step4: Calculate column totals
Sum the values down each column to find the totals.
- Total Snake = (Rabbit, Snake) + (Not rabbit, Snake) = $4 + 11 = 15$
- Total Not snake = (Rabbit, Not snake) + (Not rabbit, Not snake) = $18 + 26 = 44$
Step5: Calculate the grand total
Sum the row totals or column totals to find the grand total.
- Grand Total = Total Rabbit + Total Not rabbit = $22 + 37 = 59$
- Grand Total = Total Snake + Total Not snake = $15 + 44 = 59$
Answer:
| Snake | Not snake | Total | |
|---|---|---|---|
| Rabbit | 4 | 18 | 22 |
| Not rabbit | 11 | 26 | 37 |
| Total | 15 | 44 | 59 |